- China
- /
- Electronic Equipment and Components
- /
- SZSE:300991
Shenzhen Chuangyitong Technology Co.,Ltd.'s (SZSE:300991) Popularity With Investors Under Threat As Stock Sinks 28%

Shenzhen Chuangyitong Technology Co.,Ltd. (SZSE:300991) shares have retraced a considerable 28% in the last month, reversing a fair amount of their solid recent performance. Longer-term shareholders would now have taken a real hit with the stock declining 9.1% in the last year.
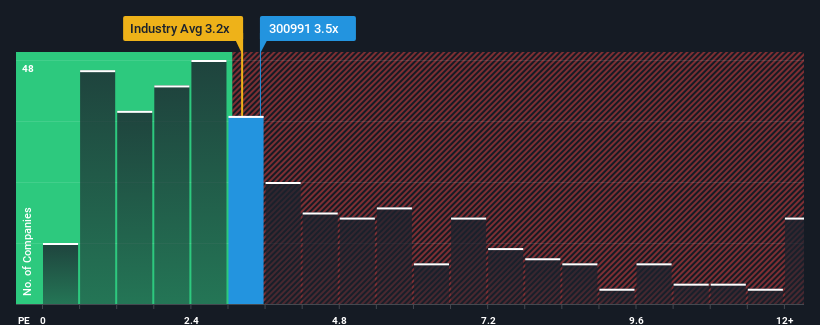
Although its price has dipped substantially, there still wouldn't be many who think Shenzhen Chuangyitong TechnologyLtd's price-to-sales (or "P/S") ratio of 3.5x is worth a mention when the median P/S in China's Electronic industry is similar at about 3.2x. Although, it's not wise to simply ignore the P/S without explanation as investors may be disregarding a distinct opportunity or a costly mistake.
View our latest analysis for Shenzhen Chuangyitong TechnologyLtd
What Does Shenzhen Chuangyitong TechnologyLtd's Recent Performance Look Like?
Shenzhen Chuangyitong TechnologyLtd certainly has been doing a great job lately as it's been growing its revenue at a really rapid pace. The P/S is probably moderate because investors think this strong revenue growth might not be enough to outperform the broader industry in the near future. Those who are bullish on Shenzhen Chuangyitong TechnologyLtd will be hoping that this isn't the case, so that they can pick up the stock at a lower valuation.
We don't have analyst forecasts, but you can see how recent trends are setting up the company for the future by checking out our free report on Shenzhen Chuangyitong TechnologyLtd's earnings, revenue and cash flow.Do Revenue Forecasts Match The P/S Ratio?
Shenzhen Chuangyitong TechnologyLtd's P/S ratio would be typical for a company that's only expected to deliver moderate growth, and importantly, perform in line with the industry.
Retrospectively, the last year delivered an exceptional 34% gain to the company's top line. As a result, it also grew revenue by 22% in total over the last three years. So we can start by confirming that the company has actually done a good job of growing revenue over that time.
Comparing the recent medium-term revenue trends against the industry's one-year growth forecast of 25% shows it's noticeably less attractive.
With this in mind, we find it intriguing that Shenzhen Chuangyitong TechnologyLtd's P/S is comparable to that of its industry peers. Apparently many investors in the company are less bearish than recent times would indicate and aren't willing to let go of their stock right now. Maintaining these prices will be difficult to achieve as a continuation of recent revenue trends is likely to weigh down the shares eventually.
The Bottom Line On Shenzhen Chuangyitong TechnologyLtd's P/S
With its share price dropping off a cliff, the P/S for Shenzhen Chuangyitong TechnologyLtd looks to be in line with the rest of the Electronic industry. It's argued the price-to-sales ratio is an inferior measure of value within certain industries, but it can be a powerful business sentiment indicator.
We've established that Shenzhen Chuangyitong TechnologyLtd's average P/S is a bit surprising since its recent three-year growth is lower than the wider industry forecast. Right now we are uncomfortable with the P/S as this revenue performance isn't likely to support a more positive sentiment for long. Unless there is a significant improvement in the company's medium-term performance, it will be difficult to prevent the P/S ratio from declining to a more reasonable level.
Don't forget that there may be other risks. For instance, we've identified 2 warning signs for Shenzhen Chuangyitong TechnologyLtd that you should be aware of.
If these risks are making you reconsider your opinion on Shenzhen Chuangyitong TechnologyLtd, explore our interactive list of high quality stocks to get an idea of what else is out there.
The New Payments ETF Is Live on NASDAQ:
Money is moving to real-time rails, and a newly listed ETF now gives investors direct exposure. Fast settlement. Institutional custody. Simple access.
Explore how this launch could reshape portfolios
Sponsored ContentNew: Manage All Your Stock Portfolios in One Place
We've created the ultimate portfolio companion for stock investors, and it's free.
• Connect an unlimited number of Portfolios and see your total in one currency
• Be alerted to new Warning Signs or Risks via email or mobile
• Track the Fair Value of your stocks
Have feedback on this article? Concerned about the content? Get in touch with us directly. Alternatively, email editorial-team (at) simplywallst.com.
This article by Simply Wall St is general in nature. We provide commentary based on historical data and analyst forecasts only using an unbiased methodology and our articles are not intended to be financial advice. It does not constitute a recommendation to buy or sell any stock, and does not take account of your objectives, or your financial situation. We aim to bring you long-term focused analysis driven by fundamental data. Note that our analysis may not factor in the latest price-sensitive company announcements or qualitative material. Simply Wall St has no position in any stocks mentioned.
About SZSE:300991
Shenzhen Chuangyitong TechnologyLtd
Shenzhen Chuangyitong Technology Co.,Ltd.
Proven track record with imperfect balance sheet.
Market Insights

Weekly Picks

THE KINGDOM OF BROWN GOODS: WHY MGPI IS BEING CRUSHED BY INVENTORY & PRIMED FOR RESURRECTION


Why Vertical Aerospace (NYSE: EVTL) is Worth Possibly Over 13x its Current Price


The Quiet Giant That Became AI’s Power Grid
Recently Updated Narratives

Butler National (Buks) outperforms.


A tech powerhouse quietly powering the world’s AI infrastructure.


Keppel DC REIT (SGX: AJBU) is a resilient gem in the data center space.
Popular Narratives

MicroVision will explode future revenue by 380.37% with a vision towards success


Crazy Undervalued 42 Baggers Silver Play (Active & Running Mine)


