- China
- /
- Electronic Equipment and Components
- /
- SZSE:002609
What You Can Learn From Shenzhen Jieshun Science and Technology Industry Co.,Ltd.'s (SZSE:002609) P/EAfter Its 28% Share Price Crash

Shenzhen Jieshun Science and Technology Industry Co.,Ltd. (SZSE:002609) shareholders won't be pleased to see that the share price has had a very rough month, dropping 28% and undoing the prior period's positive performance. Instead of being rewarded, shareholders who have already held through the last twelve months are now sitting on a 24% share price drop.
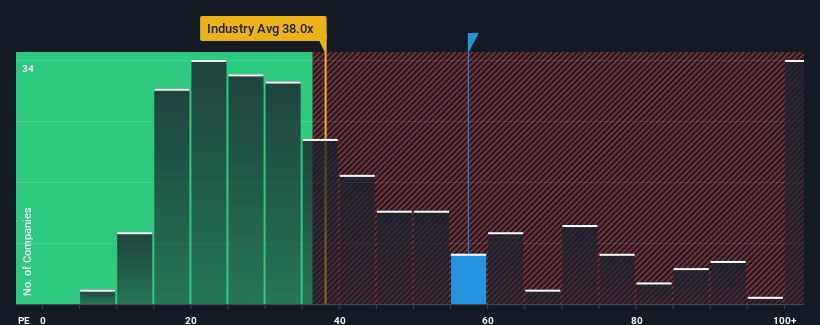
Even after such a large drop in price, given close to half the companies in China have price-to-earnings ratios (or "P/E's") below 29x, you may still consider Shenzhen Jieshun Science and Technology IndustryLtd as a stock to avoid entirely with its 57.3x P/E ratio. Nonetheless, we'd need to dig a little deeper to determine if there is a rational basis for the highly elevated P/E.
Shenzhen Jieshun Science and Technology IndustryLtd could be doing better as its earnings have been going backwards lately while most other companies have been seeing positive earnings growth. One possibility is that the P/E is high because investors think this poor earnings performance will turn the corner. If not, then existing shareholders may be extremely nervous about the viability of the share price.
See our latest analysis for Shenzhen Jieshun Science and Technology IndustryLtd
Does Growth Match The High P/E?
There's an inherent assumption that a company should far outperform the market for P/E ratios like Shenzhen Jieshun Science and Technology IndustryLtd's to be considered reasonable.
Retrospectively, the last year delivered a frustrating 13% decrease to the company's bottom line. This means it has also seen a slide in earnings over the longer-term as EPS is down 35% in total over the last three years. So unfortunately, we have to acknowledge that the company has not done a great job of growing earnings over that time.
Shifting to the future, estimates from the two analysts covering the company suggest earnings should grow by 220% over the next year. Meanwhile, the rest of the market is forecast to only expand by 35%, which is noticeably less attractive.
In light of this, it's understandable that Shenzhen Jieshun Science and Technology IndustryLtd's P/E sits above the majority of other companies. Apparently shareholders aren't keen to offload something that is potentially eyeing a more prosperous future.
What We Can Learn From Shenzhen Jieshun Science and Technology IndustryLtd's P/E?
Shenzhen Jieshun Science and Technology IndustryLtd's shares may have retreated, but its P/E is still flying high. We'd say the price-to-earnings ratio's power isn't primarily as a valuation instrument but rather to gauge current investor sentiment and future expectations.
As we suspected, our examination of Shenzhen Jieshun Science and Technology IndustryLtd's analyst forecasts revealed that its superior earnings outlook is contributing to its high P/E. At this stage investors feel the potential for a deterioration in earnings isn't great enough to justify a lower P/E ratio. It's hard to see the share price falling strongly in the near future under these circumstances.
Having said that, be aware Shenzhen Jieshun Science and Technology IndustryLtd is showing 1 warning sign in our investment analysis, you should know about.
You might be able to find a better investment than Shenzhen Jieshun Science and Technology IndustryLtd. If you want a selection of possible candidates, check out this free list of interesting companies that trade on a low P/E (but have proven they can grow earnings).
The New Payments ETF Is Live on NASDAQ:
Money is moving to real-time rails, and a newly listed ETF now gives investors direct exposure. Fast settlement. Institutional custody. Simple access.
Explore how this launch could reshape portfolios
Sponsored ContentNew: Manage All Your Stock Portfolios in One Place
We've created the ultimate portfolio companion for stock investors, and it's free.
• Connect an unlimited number of Portfolios and see your total in one currency
• Be alerted to new Warning Signs or Risks via email or mobile
• Track the Fair Value of your stocks
Have feedback on this article? Concerned about the content? Get in touch with us directly. Alternatively, email editorial-team (at) simplywallst.com.
This article by Simply Wall St is general in nature. We provide commentary based on historical data and analyst forecasts only using an unbiased methodology and our articles are not intended to be financial advice. It does not constitute a recommendation to buy or sell any stock, and does not take account of your objectives, or your financial situation. We aim to bring you long-term focused analysis driven by fundamental data. Note that our analysis may not factor in the latest price-sensitive company announcements or qualitative material. Simply Wall St has no position in any stocks mentioned.
About SZSE:002609
Shenzhen Jieshun Science and Technology IndustryLtd
Shenzhen Jieshun Science and Technology Industry Co.,Ltd.
Flawless balance sheet with reasonable growth potential and pays a dividend.
Market Insights

Weekly Picks

THE KINGDOM OF BROWN GOODS: WHY MGPI IS BEING CRUSHED BY INVENTORY & PRIMED FOR RESURRECTION


Why Vertical Aerospace (NYSE: EVTL) is Worth Possibly Over 13x its Current Price


The Quiet Giant That Became AI’s Power Grid
Recently Updated Narratives


MINISO's fair value is projected at 26.69 with an anticipated PE ratio shift of 20x

Fiverr International will transform the freelance industry with AI-powered growth

Stride Stock: Online Education Finds Its Second Act
Popular Narratives


MicroVision will explode future revenue by 380.37% with a vision towards success


Crazy Undervalued 42 Baggers Silver Play (Active & Running Mine)


