- China
- /
- Electronic Equipment and Components
- /
- SZSE:001298
Shenzhen Best of Best Holdings Co.,Ltd. (SZSE:001298) Not Doing Enough For Some Investors As Its Shares Slump 25%

Shenzhen Best of Best Holdings Co.,Ltd. (SZSE:001298) shares have had a horrible month, losing 25% after a relatively good period beforehand. Longer-term shareholders would now have taken a real hit with the stock declining 10.0% in the last year.
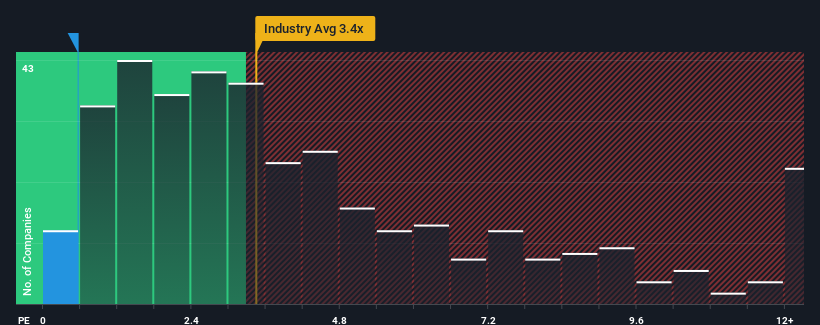
Although its price has dipped substantially, Shenzhen Best of Best HoldingsLtd may still be sending very bullish signals at the moment with its price-to-sales (or "P/S") ratio of 0.6x, since almost half of all companies in the Electronic industry in China have P/S ratios greater than 3.4x and even P/S higher than 7x are not unusual. Although, it's not wise to just take the P/S at face value as there may be an explanation why it's so limited.
View our latest analysis for Shenzhen Best of Best HoldingsLtd
What Does Shenzhen Best of Best HoldingsLtd's P/S Mean For Shareholders?
As an illustration, revenue has deteriorated at Shenzhen Best of Best HoldingsLtd over the last year, which is not ideal at all. Perhaps the market believes the recent revenue performance isn't good enough to keep up the industry, causing the P/S ratio to suffer. If you like the company, you'd be hoping this isn't the case so that you could potentially pick up some stock while it's out of favour.
Want the full picture on earnings, revenue and cash flow for the company? Then our free report on Shenzhen Best of Best HoldingsLtd will help you shine a light on its historical performance.What Are Revenue Growth Metrics Telling Us About The Low P/S?
In order to justify its P/S ratio, Shenzhen Best of Best HoldingsLtd would need to produce anemic growth that's substantially trailing the industry.
Retrospectively, the last year delivered a frustrating 18% decrease to the company's top line. This has soured the latest three-year period, which nevertheless managed to deliver a decent 5.7% overall rise in revenue. Although it's been a bumpy ride, it's still fair to say the revenue growth recently has been mostly respectable for the company.
This is in contrast to the rest of the industry, which is expected to grow by 23% over the next year, materially higher than the company's recent medium-term annualised growth rates.
With this information, we can see why Shenzhen Best of Best HoldingsLtd is trading at a P/S lower than the industry. Apparently many shareholders weren't comfortable holding on to something they believe will continue to trail the wider industry.
The Key Takeaway
Shares in Shenzhen Best of Best HoldingsLtd have plummeted and its P/S has followed suit. Generally, our preference is to limit the use of the price-to-sales ratio to establishing what the market thinks about the overall health of a company.
Our examination of Shenzhen Best of Best HoldingsLtd confirms that the company's revenue trends over the past three-year years are a key factor in its low price-to-sales ratio, as we suspected, given they fall short of current industry expectations. Right now shareholders are accepting the low P/S as they concede future revenue probably won't provide any pleasant surprises. If recent medium-term revenue trends continue, it's hard to see the share price experience a reversal of fortunes anytime soon.
We don't want to rain on the parade too much, but we did also find 4 warning signs for Shenzhen Best of Best HoldingsLtd (1 is a bit unpleasant!) that you need to be mindful of.
Of course, profitable companies with a history of great earnings growth are generally safer bets. So you may wish to see this free collection of other companies that have reasonable P/E ratios and have grown earnings strongly.
Mobile Infrastructure for Defense and Disaster
The next wave in robotics isn't humanoid. Its fully autonomous towers delivering 5G, ISR, and radar in under 30 minutes, anywhere.
Get the investor briefing before the next round of contracts
Sponsored On Behalf of CiTechNew: Manage All Your Stock Portfolios in One Place
We've created the ultimate portfolio companion for stock investors, and it's free.
• Connect an unlimited number of Portfolios and see your total in one currency
• Be alerted to new Warning Signs or Risks via email or mobile
• Track the Fair Value of your stocks
Have feedback on this article? Concerned about the content? Get in touch with us directly. Alternatively, email editorial-team (at) simplywallst.com.
This article by Simply Wall St is general in nature. We provide commentary based on historical data and analyst forecasts only using an unbiased methodology and our articles are not intended to be financial advice. It does not constitute a recommendation to buy or sell any stock, and does not take account of your objectives, or your financial situation. We aim to bring you long-term focused analysis driven by fundamental data. Note that our analysis may not factor in the latest price-sensitive company announcements or qualitative material. Simply Wall St has no position in any stocks mentioned.
About SZSE:001298
Shenzhen Best of Best HoldingsLtd
Distributes electronic component in the People's Republic of China.
Adequate balance sheet with slight risk.
Market Insights

Weekly Picks

THE KINGDOM OF BROWN GOODS: WHY MGPI IS BEING CRUSHED BY INVENTORY & PRIMED FOR RESURRECTION


Why Vertical Aerospace (NYSE: EVTL) is Worth Possibly Over 13x its Current Price


The Quiet Giant That Became AI’s Power Grid
Recently Updated Narratives


A case for USD $14.81 per share based on book value. Be warned, this is a micro-cap dependent on a single mine.

Occidental Petroleum to Become Fairly Priced at $68.29 According to Future Projections

Agfa-Gevaert is a digital and materials turnaround opportunity, with growth potential in ZIRFON, but carrying legacy risks.
Popular Narratives


MicroVision will explode future revenue by 380.37% with a vision towards success


Crazy Undervalued 42 Baggers Silver Play (Active & Running Mine)


