- China
- /
- Electronic Equipment and Components
- /
- SZSE:001298
Returns On Capital At Shenzhen Best of Best HoldingsLtd (SZSE:001298) Paint A Concerning Picture

To find a multi-bagger stock, what are the underlying trends we should look for in a business? Typically, we'll want to notice a trend of growing return on capital employed (ROCE) and alongside that, an expanding base of capital employed. Ultimately, this demonstrates that it's a business that is reinvesting profits at increasing rates of return. Although, when we looked at Shenzhen Best of Best HoldingsLtd (SZSE:001298), it didn't seem to tick all of these boxes.
Understanding Return On Capital Employed (ROCE)
For those that aren't sure what ROCE is, it measures the amount of pre-tax profits a company can generate from the capital employed in its business. Analysts use this formula to calculate it for Shenzhen Best of Best HoldingsLtd:
Return on Capital Employed = Earnings Before Interest and Tax (EBIT) ÷ (Total Assets - Current Liabilities)
0.071 = CN¥110m ÷ (CN¥2.7b - CN¥1.2b) (Based on the trailing twelve months to September 2023).
Thus, Shenzhen Best of Best HoldingsLtd has an ROCE of 7.1%. In absolute terms, that's a low return, but it's much better than the Electronic industry average of 5.4%.
View our latest analysis for Shenzhen Best of Best HoldingsLtd
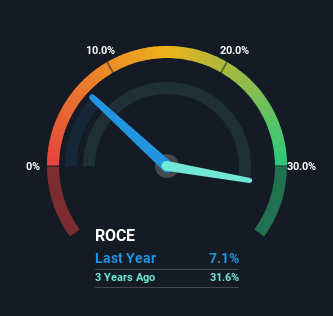
Historical performance is a great place to start when researching a stock so above you can see the gauge for Shenzhen Best of Best HoldingsLtd's ROCE against it's prior returns. If you'd like to look at how Shenzhen Best of Best HoldingsLtd has performed in the past in other metrics, you can view this free graph of Shenzhen Best of Best HoldingsLtd's past earnings, revenue and cash flow.
What The Trend Of ROCE Can Tell Us
In terms of Shenzhen Best of Best HoldingsLtd's historical ROCE movements, the trend isn't fantastic. Over the last four years, returns on capital have decreased to 7.1% from 33% four years ago. Given the business is employing more capital while revenue has slipped, this is a bit concerning. This could mean that the business is losing its competitive advantage or market share, because while more money is being put into ventures, it's actually producing a lower return - "less bang for their buck" per se.
On a side note, Shenzhen Best of Best HoldingsLtd has done well to pay down its current liabilities to 43% of total assets. That could partly explain why the ROCE has dropped. What's more, this can reduce some aspects of risk to the business because now the company's suppliers or short-term creditors are funding less of its operations. Some would claim this reduces the business' efficiency at generating ROCE since it is now funding more of the operations with its own money. Keep in mind 43% is still pretty high, so those risks are still somewhat prevalent.
What We Can Learn From Shenzhen Best of Best HoldingsLtd's ROCE
In summary, we're somewhat concerned by Shenzhen Best of Best HoldingsLtd's diminishing returns on increasing amounts of capital. Long term shareholders who've owned the stock over the last year have experienced a 19% depreciation in their investment, so it appears the market might not like these trends either. That being the case, unless the underlying trends revert to a more positive trajectory, we'd consider looking elsewhere.
Shenzhen Best of Best HoldingsLtd does come with some risks though, we found 5 warning signs in our investment analysis, and 1 of those shouldn't be ignored...
For those who like to invest in solid companies, check out this free list of companies with solid balance sheets and high returns on equity.
The New Payments ETF Is Live on NASDAQ:
Money is moving to real-time rails, and a newly listed ETF now gives investors direct exposure. Fast settlement. Institutional custody. Simple access.
Explore how this launch could reshape portfolios
Sponsored ContentNew: Manage All Your Stock Portfolios in One Place
We've created the ultimate portfolio companion for stock investors, and it's free.
• Connect an unlimited number of Portfolios and see your total in one currency
• Be alerted to new Warning Signs or Risks via email or mobile
• Track the Fair Value of your stocks
Have feedback on this article? Concerned about the content? Get in touch with us directly. Alternatively, email editorial-team (at) simplywallst.com.
This article by Simply Wall St is general in nature. We provide commentary based on historical data and analyst forecasts only using an unbiased methodology and our articles are not intended to be financial advice. It does not constitute a recommendation to buy or sell any stock, and does not take account of your objectives, or your financial situation. We aim to bring you long-term focused analysis driven by fundamental data. Note that our analysis may not factor in the latest price-sensitive company announcements or qualitative material. Simply Wall St has no position in any stocks mentioned.
About SZSE:001298
Shenzhen Best of Best HoldingsLtd
Distributes electronic component in the People's Republic of China.
Adequate balance sheet with slight risk.
Market Insights

Weekly Picks

THE KINGDOM OF BROWN GOODS: WHY MGPI IS BEING CRUSHED BY INVENTORY & PRIMED FOR RESURRECTION


Why Vertical Aerospace (NYSE: EVTL) is Worth Possibly Over 13x its Current Price


The Quiet Giant That Became AI’s Power Grid
Recently Updated Narratives

Agfa-Gevaert is a digital and materials turnaround opportunity, with growth potential in ZIRFON, but carrying legacy risks.

Hitit Bilgisayar Hizmetleri will achieve a 19.7% revenue boost in the next five years


MINISO's fair value is projected at 26.69 with an anticipated PE ratio shift of 20x
Popular Narratives


MicroVision will explode future revenue by 380.37% with a vision towards success


Crazy Undervalued 42 Baggers Silver Play (Active & Running Mine)


