- China
- /
- Electronic Equipment and Components
- /
- SHSE:688312
Shenzhen Yanmade Technology Inc.'s (SHSE:688312) 31% Price Boost Is Out Of Tune With Earnings

Those holding Shenzhen Yanmade Technology Inc. (SHSE:688312) shares would be relieved that the share price has rebounded 31% in the last thirty days, but it needs to keep going to repair the recent damage it has caused to investor portfolios. But the gains over the last month weren't enough to make shareholders whole, as the share price is still down 9.9% in the last twelve months.
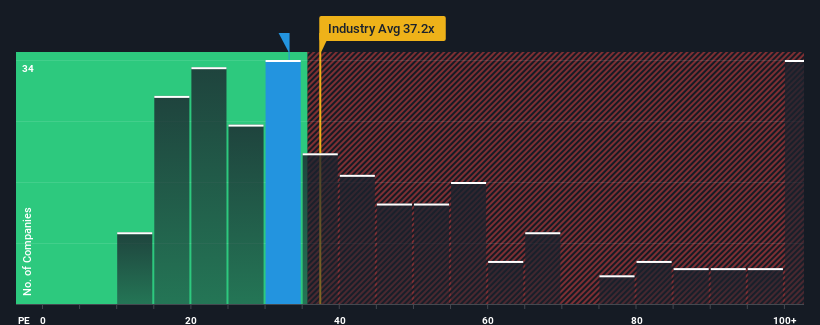
After such a large jump in price, Shenzhen Yanmade Technology may be sending bearish signals at the moment with its price-to-earnings (or "P/E") ratio of 33.1x, since almost half of all companies in China have P/E ratios under 29x and even P/E's lower than 18x are not unusual. Although, it's not wise to just take the P/E at face value as there may be an explanation why it's as high as it is.
As an illustration, earnings have deteriorated at Shenzhen Yanmade Technology over the last year, which is not ideal at all. One possibility is that the P/E is high because investors think the company will still do enough to outperform the broader market in the near future. You'd really hope so, otherwise you're paying a pretty hefty price for no particular reason.
See our latest analysis for Shenzhen Yanmade Technology
What Are Growth Metrics Telling Us About The High P/E?
There's an inherent assumption that a company should outperform the market for P/E ratios like Shenzhen Yanmade Technology's to be considered reasonable.
If we review the last year of earnings, dishearteningly the company's profits fell to the tune of 16%. As a result, earnings from three years ago have also fallen 41% overall. Accordingly, shareholders would have felt downbeat about the medium-term rates of earnings growth.
Comparing that to the market, which is predicted to deliver 41% growth in the next 12 months, the company's downward momentum based on recent medium-term earnings results is a sobering picture.
With this information, we find it concerning that Shenzhen Yanmade Technology is trading at a P/E higher than the market. Apparently many investors in the company are way more bullish than recent times would indicate and aren't willing to let go of their stock at any price. There's a very good chance existing shareholders are setting themselves up for future disappointment if the P/E falls to levels more in line with the recent negative growth rates.
The Key Takeaway
Shenzhen Yanmade Technology's P/E is getting right up there since its shares have risen strongly. Typically, we'd caution against reading too much into price-to-earnings ratios when settling on investment decisions, though it can reveal plenty about what other market participants think about the company.
Our examination of Shenzhen Yanmade Technology revealed its shrinking earnings over the medium-term aren't impacting its high P/E anywhere near as much as we would have predicted, given the market is set to grow. Right now we are increasingly uncomfortable with the high P/E as this earnings performance is highly unlikely to support such positive sentiment for long. If recent medium-term earnings trends continue, it will place shareholders' investments at significant risk and potential investors in danger of paying an excessive premium.
Plus, you should also learn about these 3 warning signs we've spotted with Shenzhen Yanmade Technology (including 1 which is significant).
If P/E ratios interest you, you may wish to see this free collection of other companies with strong earnings growth and low P/E ratios.
Mobile Infrastructure for Defense and Disaster
The next wave in robotics isn't humanoid. Its fully autonomous towers delivering 5G, ISR, and radar in under 30 minutes, anywhere.
Get the investor briefing before the next round of contracts
Sponsored On Behalf of CiTechNew: Manage All Your Stock Portfolios in One Place
We've created the ultimate portfolio companion for stock investors, and it's free.
• Connect an unlimited number of Portfolios and see your total in one currency
• Be alerted to new Warning Signs or Risks via email or mobile
• Track the Fair Value of your stocks
Have feedback on this article? Concerned about the content? Get in touch with us directly. Alternatively, email editorial-team (at) simplywallst.com.
This article by Simply Wall St is general in nature. We provide commentary based on historical data and analyst forecasts only using an unbiased methodology and our articles are not intended to be financial advice. It does not constitute a recommendation to buy or sell any stock, and does not take account of your objectives, or your financial situation. We aim to bring you long-term focused analysis driven by fundamental data. Note that our analysis may not factor in the latest price-sensitive company announcements or qualitative material. Simply Wall St has no position in any stocks mentioned.
About SHSE:688312
Shenzhen Yanmade Technology
Engages in the research, design, development, production, and sale of automated and intelligent testing equipment in China and internationally.
Excellent balance sheet with reasonable growth potential.
Market Insights

Weekly Picks

THE KINGDOM OF BROWN GOODS: WHY MGPI IS BEING CRUSHED BY INVENTORY & PRIMED FOR RESURRECTION


Why Vertical Aerospace (NYSE: EVTL) is Worth Possibly Over 13x its Current Price


The Quiet Giant That Became AI’s Power Grid
Recently Updated Narratives


A case for CA$31.80 (undiluted), aka 8,616% upside from CA$0.37 (an 86 bagger!).


Unicycive Therapeutics (Nasdaq: UNCY) – Preparing for a Second Shot at Bringing a New Kidney Treatment to Market (TEST)

Rocket Lab USA Will Ignite a 30% Revenue Growth Journey
Popular Narratives


MicroVision will explode future revenue by 380.37% with a vision towards success


NVDA: Expanding AI Demand Will Drive Major Data Center Investments Through 2026


Crazy Undervalued 42 Baggers Silver Play (Active & Running Mine)
Trending Discussion