
Advertisement
Further Upside For GuoChuang Software Co.,Ltd. (SZSE:300520) Shares Could Introduce Price Risks After 29% Bounce
GuoChuang Software Co.,Ltd. (SZSE:300520) shareholders would be excited to see that the share price has had a great month, posting a 29% gain and recovering from prior weakness. But the gains over the last month weren't enough to make shareholders whole, as the share price is still down 9.1% in the last twelve months.
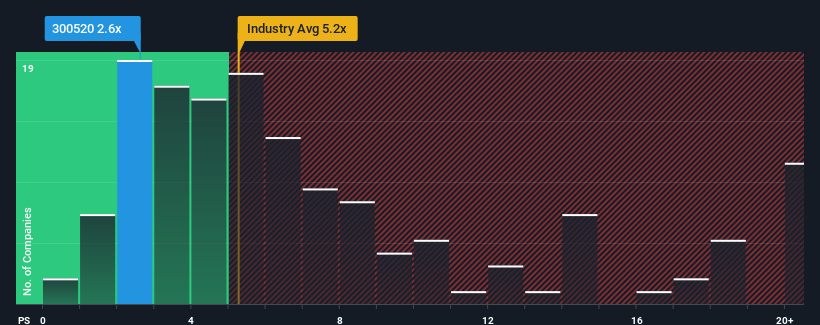
Although its price has surged higher, GuoChuang SoftwareLtd may still be sending very bullish signals at the moment with its price-to-sales (or "P/S") ratio of 2.6x, since almost half of all companies in the Software industry in China have P/S ratios greater than 5.2x and even P/S higher than 9x are not unusual. Although, it's not wise to just take the P/S at face value as there may be an explanation why it's so limited.
See our latest analysis for GuoChuang SoftwareLtd
How GuoChuang SoftwareLtd Has Been Performing
GuoChuang SoftwareLtd hasn't been tracking well recently as its declining revenue compares poorly to other companies, which have seen some growth in their revenues on average. It seems that many are expecting the poor revenue performance to persist, which has repressed the P/S ratio. If you still like the company, you'd be hoping this isn't the case so that you could potentially pick up some stock while it's out of favour.
If you'd like to see what analysts are forecasting going forward, you should check out our free report on GuoChuang SoftwareLtd.What Are Revenue Growth Metrics Telling Us About The Low P/S?
GuoChuang SoftwareLtd's P/S ratio would be typical for a company that's expected to deliver very poor growth or even falling revenue, and importantly, perform much worse than the industry.
Retrospectively, the last year delivered a frustrating 24% decrease to the company's top line. Still, the latest three year period has seen an excellent 47% overall rise in revenue, in spite of its unsatisfying short-term performance. So we can start by confirming that the company has generally done a very good job of growing revenue over that time, even though it had some hiccups along the way.
Looking ahead now, revenue is anticipated to climb by 46% during the coming year according to the lone analyst following the company. Meanwhile, the rest of the industry is forecast to only expand by 26%, which is noticeably less attractive.
With this in consideration, we find it intriguing that GuoChuang SoftwareLtd's P/S sits behind most of its industry peers. It looks like most investors are not convinced at all that the company can achieve future growth expectations.
What Does GuoChuang SoftwareLtd's P/S Mean For Investors?
Shares in GuoChuang SoftwareLtd have risen appreciably however, its P/S is still subdued. Generally, our preference is to limit the use of the price-to-sales ratio to establishing what the market thinks about the overall health of a company.
GuoChuang SoftwareLtd's analyst forecasts revealed that its superior revenue outlook isn't contributing to its P/S anywhere near as much as we would have predicted. There could be some major risk factors that are placing downward pressure on the P/S ratio. At least price risks look to be very low, but investors seem to think future revenues could see a lot of volatility.
You always need to take note of risks, for example - GuoChuang SoftwareLtd has 1 warning sign we think you should be aware of.
Of course, profitable companies with a history of great earnings growth are generally safer bets. So you may wish to see this free collection of other companies that have reasonable P/E ratios and have grown earnings strongly.
New: Manage All Your Stock Portfolios in One Place
We've created the ultimate portfolio companion for stock investors, and it's free.
• Connect an unlimited number of Portfolios and see your total in one currency
• Be alerted to new Warning Signs or Risks via email or mobile
• Track the Fair Value of your stocks
Have feedback on this article? Concerned about the content? Get in touch with us directly. Alternatively, email editorial-team (at) simplywallst.com.
This article by Simply Wall St is general in nature. We provide commentary based on historical data and analyst forecasts only using an unbiased methodology and our articles are not intended to be financial advice. It does not constitute a recommendation to buy or sell any stock, and does not take account of your objectives, or your financial situation. We aim to bring you long-term focused analysis driven by fundamental data. Note that our analysis may not factor in the latest price-sensitive company announcements or qualitative material. Simply Wall St has no position in any stocks mentioned.
About SZSE:300520
GuoChuang SoftwareLtd
Operates as a software company in China and internationally.
Excellent balance sheet and fair value.
Market Insights

Advertisement
Community Narratives
MicroVision will explode future revenue by 380.37% with a vision towards success
Fair Value US$60.00|98.4% undervalued
TH
Community Contributor
The Indispensable Artery for a New North American Economy
Fair Value CA$132.87|1.3% undervalued
TI
Community Contributor