Some Confidence Is Lacking In Great Chinasoft Technology Co.,Ltd. (SZSE:002453) As Shares Slide 28%

To the annoyance of some shareholders, Great Chinasoft Technology Co.,Ltd. (SZSE:002453) shares are down a considerable 28% in the last month, which continues a horrid run for the company. The recent drop completes a disastrous twelve months for shareholders, who are sitting on a 59% loss during that time.
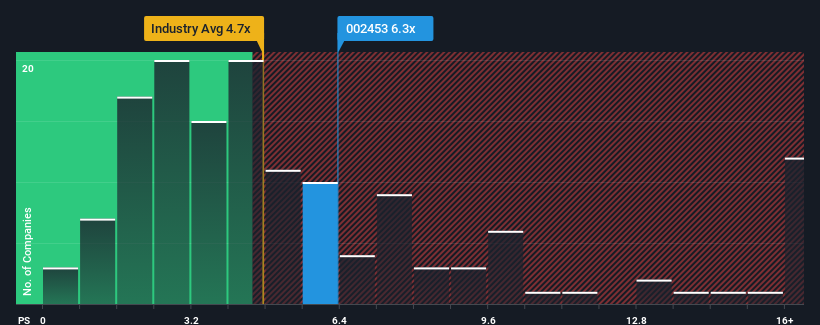
Although its price has dipped substantially, Great Chinasoft TechnologyLtd may still be sending sell signals at present with a price-to-sales (or "P/S") ratio of 6.3x, when you consider almost half of the companies in the Software industry in China have P/S ratios under 4.7x and even P/S lower than 2x aren't out of the ordinary. Although, it's not wise to just take the P/S at face value as there may be an explanation why it's as high as it is.
See our latest analysis for Great Chinasoft TechnologyLtd
What Does Great Chinasoft TechnologyLtd's P/S Mean For Shareholders?
As an illustration, revenue has deteriorated at Great Chinasoft TechnologyLtd over the last year, which is not ideal at all. Perhaps the market believes the company can do enough to outperform the rest of the industry in the near future, which is keeping the P/S ratio high. However, if this isn't the case, investors might get caught out paying too much for the stock.
Although there are no analyst estimates available for Great Chinasoft TechnologyLtd, take a look at this free data-rich visualisation to see how the company stacks up on earnings, revenue and cash flow.What Are Revenue Growth Metrics Telling Us About The High P/S?
In order to justify its P/S ratio, Great Chinasoft TechnologyLtd would need to produce impressive growth in excess of the industry.
In reviewing the last year of financials, we were disheartened to see the company's revenues fell to the tune of 71%. As a result, revenue from three years ago have also fallen 82% overall. So unfortunately, we have to acknowledge that the company has not done a great job of growing revenue over that time.
Comparing that to the industry, which is predicted to deliver 31% growth in the next 12 months, the company's downward momentum based on recent medium-term revenue results is a sobering picture.
With this information, we find it concerning that Great Chinasoft TechnologyLtd is trading at a P/S higher than the industry. It seems most investors are ignoring the recent poor growth rate and are hoping for a turnaround in the company's business prospects. There's a very good chance existing shareholders are setting themselves up for future disappointment if the P/S falls to levels more in line with the recent negative growth rates.
The Bottom Line On Great Chinasoft TechnologyLtd's P/S
There's still some elevation in Great Chinasoft TechnologyLtd's P/S, even if the same can't be said for its share price recently. It's argued the price-to-sales ratio is an inferior measure of value within certain industries, but it can be a powerful business sentiment indicator.
Our examination of Great Chinasoft TechnologyLtd revealed its shrinking revenue over the medium-term isn't resulting in a P/S as low as we expected, given the industry is set to grow. Right now we aren't comfortable with the high P/S as this revenue performance is highly unlikely to support such positive sentiment for long. Unless the recent medium-term conditions improve markedly, investors will have a hard time accepting the share price as fair value.
Plus, you should also learn about this 1 warning sign we've spotted with Great Chinasoft TechnologyLtd.
If strong companies turning a profit tickle your fancy, then you'll want to check out this free list of interesting companies that trade on a low P/E (but have proven they can grow earnings).
The New Payments ETF Is Live on NASDAQ:
Money is moving to real-time rails, and a newly listed ETF now gives investors direct exposure. Fast settlement. Institutional custody. Simple access.
Explore how this launch could reshape portfolios
Sponsored ContentNew: Manage All Your Stock Portfolios in One Place
We've created the ultimate portfolio companion for stock investors, and it's free.
• Connect an unlimited number of Portfolios and see your total in one currency
• Be alerted to new Warning Signs or Risks via email or mobile
• Track the Fair Value of your stocks
Have feedback on this article? Concerned about the content? Get in touch with us directly. Alternatively, email editorial-team (at) simplywallst.com.
This article by Simply Wall St is general in nature. We provide commentary based on historical data and analyst forecasts only using an unbiased methodology and our articles are not intended to be financial advice. It does not constitute a recommendation to buy or sell any stock, and does not take account of your objectives, or your financial situation. We aim to bring you long-term focused analysis driven by fundamental data. Note that our analysis may not factor in the latest price-sensitive company announcements or qualitative material. Simply Wall St has no position in any stocks mentioned.
About SZSE:002453
Flawless balance sheet with very low risk.
Market Insights

Weekly Picks

THE KINGDOM OF BROWN GOODS: WHY MGPI IS BEING CRUSHED BY INVENTORY & PRIMED FOR RESURRECTION


Why Vertical Aerospace (NYSE: EVTL) is Worth Possibly Over 13x its Current Price


The Quiet Giant That Became AI’s Power Grid
Recently Updated Narratives


MINISO's fair value is projected at 26.69 with an anticipated PE ratio shift of 20x

Fiverr International will transform the freelance industry with AI-powered growth

Stride Stock: Online Education Finds Its Second Act
Popular Narratives


MicroVision will explode future revenue by 380.37% with a vision towards success


Crazy Undervalued 42 Baggers Silver Play (Active & Running Mine)


