- China
- /
- Semiconductors
- /
- SHSE:688362
Forehope Electronic (Ningbo) Co., Ltd. (SHSE:688362) Surges 47% Yet Its Low P/S Is No Reason For Excitement

Despite an already strong run, Forehope Electronic (Ningbo) Co., Ltd. (SHSE:688362) shares have been powering on, with a gain of 47% in the last thirty days. The bad news is that even after the stocks recovery in the last 30 days, shareholders are still underwater by about 5.9% over the last year.
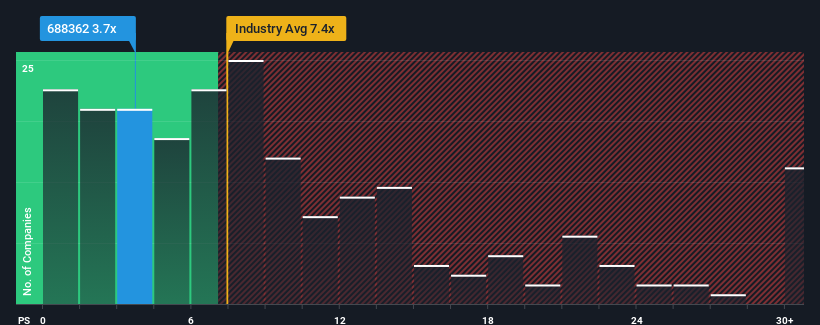
Even after such a large jump in price, Forehope Electronic (Ningbo) may still be sending buy signals at present with its price-to-sales (or "P/S") ratio of 3.7x, considering almost half of all companies in the Semiconductor industry in China have P/S ratios greater than 7.4x and even P/S higher than 13x aren't out of the ordinary. Although, it's not wise to just take the P/S at face value as there may be an explanation why it's limited.
View our latest analysis for Forehope Electronic (Ningbo)

How Forehope Electronic (Ningbo) Has Been Performing
Recent times have been advantageous for Forehope Electronic (Ningbo) as its revenues have been rising faster than most other companies. Perhaps the market is expecting future revenue performance to dive, which has kept the P/S suppressed. If you like the company, you'd be hoping this isn't the case so that you could potentially pick up some stock while it's out of favour.
Want the full picture on analyst estimates for the company? Then our free report on Forehope Electronic (Ningbo) will help you uncover what's on the horizon.Do Revenue Forecasts Match The Low P/S Ratio?
Forehope Electronic (Ningbo)'s P/S ratio would be typical for a company that's only expected to deliver limited growth, and importantly, perform worse than the industry.
If we review the last year of revenue growth, the company posted a terrific increase of 58%. The latest three year period has also seen an excellent 61% overall rise in revenue, aided by its short-term performance. Accordingly, shareholders would have definitely welcomed those medium-term rates of revenue growth.
Turning to the outlook, the next year should generate growth of 21% as estimated by the dual analysts watching the company. With the industry predicted to deliver 42% growth, the company is positioned for a weaker revenue result.
With this in consideration, its clear as to why Forehope Electronic (Ningbo)'s P/S is falling short industry peers. It seems most investors are expecting to see limited future growth and are only willing to pay a reduced amount for the stock.
The Final Word
The latest share price surge wasn't enough to lift Forehope Electronic (Ningbo)'s P/S close to the industry median. Generally, our preference is to limit the use of the price-to-sales ratio to establishing what the market thinks about the overall health of a company.
We've established that Forehope Electronic (Ningbo) maintains its low P/S on the weakness of its forecast growth being lower than the wider industry, as expected. Right now shareholders are accepting the low P/S as they concede future revenue probably won't provide any pleasant surprises. It's hard to see the share price rising strongly in the near future under these circumstances.
Before you take the next step, you should know about the 3 warning signs for Forehope Electronic (Ningbo) (2 shouldn't be ignored!) that we have uncovered.
If you're unsure about the strength of Forehope Electronic (Ningbo)'s business, why not explore our interactive list of stocks with solid business fundamentals for some other companies you may have missed.
If you're looking to trade Forehope Electronic (Ningbo), open an account with the lowest-cost platform trusted by professionals, Interactive Brokers.
With clients in over 200 countries and territories, and access to 160 markets, IBKR lets you trade stocks, options, futures, forex, bonds and funds from a single integrated account.
Enjoy no hidden fees, no account minimums, and FX conversion rates as low as 0.03%, far better than what most brokers offer.
Sponsored ContentNew: AI Stock Screener & Alerts
Our new AI Stock Screener scans the market every day to uncover opportunities.
• Dividend Powerhouses (3%+ Yield)
• Undervalued Small Caps with Insider Buying
• High growth Tech and AI Companies
Or build your own from over 50 metrics.
Have feedback on this article? Concerned about the content? Get in touch with us directly. Alternatively, email editorial-team (at) simplywallst.com.
This article by Simply Wall St is general in nature. We provide commentary based on historical data and analyst forecasts only using an unbiased methodology and our articles are not intended to be financial advice. It does not constitute a recommendation to buy or sell any stock, and does not take account of your objectives, or your financial situation. We aim to bring you long-term focused analysis driven by fundamental data. Note that our analysis may not factor in the latest price-sensitive company announcements or qualitative material. Simply Wall St has no position in any stocks mentioned.
About SHSE:688362
Forehope Electronic (Ningbo)
Engages in packaging and testing of integrated circuits.
High growth potential low.
Market Insights
Community Narratives


