
Advertisement
- China
- /
- Semiconductors
- /
- SHSE:688362
Forehope Electronic (Ningbo) Co., Ltd. (SHSE:688362) Held Back By Insufficient Growth Even After Shares Climb 28%

Forehope Electronic (Ningbo) Co., Ltd. (SHSE:688362) shareholders are no doubt pleased to see that the share price has bounced 28% in the last month, although it is still struggling to make up recently lost ground. Not all shareholders will be feeling jubilant, since the share price is still down a very disappointing 15% in the last twelve months.
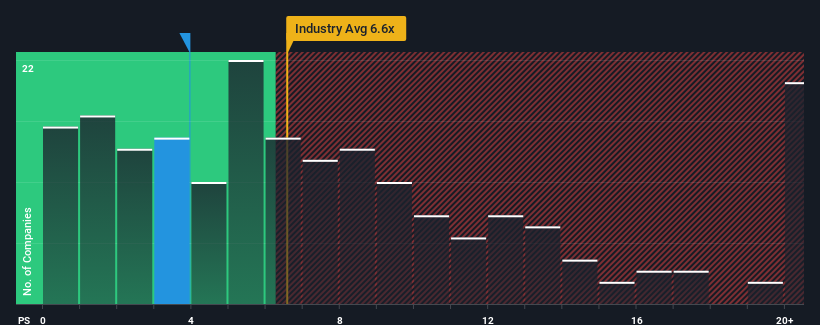
Although its price has surged higher, Forehope Electronic (Ningbo)'s price-to-sales (or "P/S") ratio of 3.9x might still make it look like a buy right now compared to the Semiconductor industry in China, where around half of the companies have P/S ratios above 6.6x and even P/S above 12x are quite common. Although, it's not wise to just take the P/S at face value as there may be an explanation why it's limited.
View our latest analysis for Forehope Electronic (Ningbo)
How Forehope Electronic (Ningbo) Has Been Performing
Recent times haven't been great for Forehope Electronic (Ningbo) as its revenue has been rising slower than most other companies. The P/S ratio is probably low because investors think this lacklustre revenue performance isn't going to get any better. If you still like the company, you'd be hoping revenue doesn't get any worse and that you could pick up some stock while it's out of favour.
If you'd like to see what analysts are forecasting going forward, you should check out our free report on Forehope Electronic (Ningbo).How Is Forehope Electronic (Ningbo)'s Revenue Growth Trending?
In order to justify its P/S ratio, Forehope Electronic (Ningbo) would need to produce sluggish growth that's trailing the industry.
Taking a look back first, we see that the company managed to grow revenues by a handy 9.9% last year. The latest three year period has also seen an excellent 220% overall rise in revenue, aided somewhat by its short-term performance. So we can start by confirming that the company has done a great job of growing revenues over that time.
Looking ahead now, revenue is anticipated to climb by 35% during the coming year according to the three analysts following the company. With the industry predicted to deliver 20,706% growth, the company is positioned for a weaker revenue result.
With this information, we can see why Forehope Electronic (Ningbo) is trading at a P/S lower than the industry. It seems most investors are expecting to see limited future growth and are only willing to pay a reduced amount for the stock.
What We Can Learn From Forehope Electronic (Ningbo)'s P/S?
Forehope Electronic (Ningbo)'s stock price has surged recently, but its but its P/S still remains modest. It's argued the price-to-sales ratio is an inferior measure of value within certain industries, but it can be a powerful business sentiment indicator.
As expected, our analysis of Forehope Electronic (Ningbo)'s analyst forecasts confirms that the company's underwhelming revenue outlook is a major contributor to its low P/S. Shareholders' pessimism on the revenue prospects for the company seems to be the main contributor to the depressed P/S. It's hard to see the share price rising strongly in the near future under these circumstances.
And what about other risks? Every company has them, and we've spotted 2 warning signs for Forehope Electronic (Ningbo) (of which 1 is potentially serious!) you should know about.
It's important to make sure you look for a great company, not just the first idea you come across. So if growing profitability aligns with your idea of a great company, take a peek at this free list of interesting companies with strong recent earnings growth (and a low P/E).
New: AI Stock Screener & Alerts
Our new AI Stock Screener scans the market every day to uncover opportunities.
• Dividend Powerhouses (3%+ Yield)
• Undervalued Small Caps with Insider Buying
• High growth Tech and AI Companies
Or build your own from over 50 metrics.
Have feedback on this article? Concerned about the content? Get in touch with us directly. Alternatively, email editorial-team (at) simplywallst.com.
This article by Simply Wall St is general in nature. We provide commentary based on historical data and analyst forecasts only using an unbiased methodology and our articles are not intended to be financial advice. It does not constitute a recommendation to buy or sell any stock, and does not take account of your objectives, or your financial situation. We aim to bring you long-term focused analysis driven by fundamental data. Note that our analysis may not factor in the latest price-sensitive company announcements or qualitative material. Simply Wall St has no position in any stocks mentioned.
About SHSE:688362
Forehope Electronic (Ningbo)
Engages in packaging and testing of integrated circuits.
High growth potential low.
Market Insights

Advertisement
Community Narratives
Scaling up in building materials with smart M&A and growing profitability
Fair Value US$2.77|31.0% undervalued
CM
Community Contributor
Hims: The Platform Powering Personalised Healthcare
Fair Value US$114.01|53.1% undervalued
BL
Community Contributor
Undervalued lottery company with strong fundamentals
Fair Value AU$15.00|34.5% undervalued
RO
Community Contributor
Proximus, transferring money from the impatient to the patient investor
Fair Value €16.62|54.5% undervalued
AX
Community Contributor