- China
- /
- General Merchandise and Department Stores
- /
- SHSE:601366
Liqun Commercial Group Co.,Ltd. (SHSE:601366) Surges 30% Yet Its Low P/S Is No Reason For Excitement

Liqun Commercial Group Co.,Ltd. (SHSE:601366) shareholders are no doubt pleased to see that the share price has bounced 30% in the last month, although it is still struggling to make up recently lost ground. Not all shareholders will be feeling jubilant, since the share price is still down a very disappointing 13% in the last twelve months.
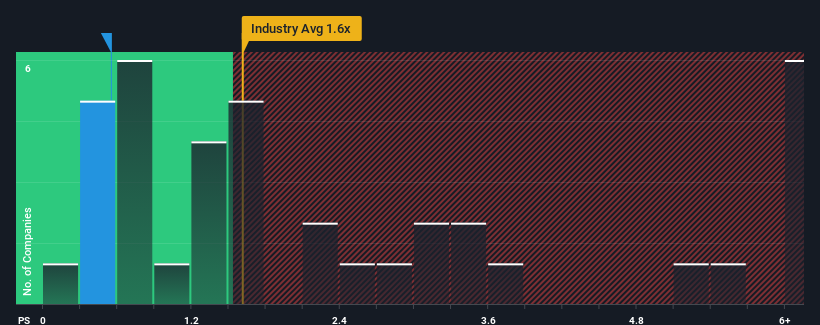
Even after such a large jump in price, Liqun Commercial GroupLtd may still be sending buy signals at present with its price-to-sales (or "P/S") ratio of 0.5x, considering almost half of all companies in the Multiline Retail industry in China have P/S ratios greater than 1.6x and even P/S higher than 4x aren't out of the ordinary. Although, it's not wise to just take the P/S at face value as there may be an explanation why it's limited.
Check out our latest analysis for Liqun Commercial GroupLtd
What Does Liqun Commercial GroupLtd's P/S Mean For Shareholders?
It looks like revenue growth has deserted Liqun Commercial GroupLtd recently, which is not something to boast about. Perhaps the market believes the recent lacklustre revenue performance is a sign of future underperformance relative to industry peers, hurting the P/S. Those who are bullish on Liqun Commercial GroupLtd will be hoping that this isn't the case, so that they can pick up the stock at a lower valuation.
We don't have analyst forecasts, but you can see how recent trends are setting up the company for the future by checking out our free report on Liqun Commercial GroupLtd's earnings, revenue and cash flow.Do Revenue Forecasts Match The Low P/S Ratio?
Liqun Commercial GroupLtd's P/S ratio would be typical for a company that's only expected to deliver limited growth, and importantly, perform worse than the industry.
If we review the last year of revenue, the company posted a result that saw barely any deviation from a year ago. This isn't what shareholders were looking for as it means they've been left with a 18% decline in revenue over the last three years in total. Therefore, it's fair to say the revenue growth recently has been undesirable for the company.
Weighing that medium-term revenue trajectory against the broader industry's one-year forecast for expansion of 24% shows it's an unpleasant look.
With this in mind, we understand why Liqun Commercial GroupLtd's P/S is lower than most of its industry peers. Nonetheless, there's no guarantee the P/S has reached a floor yet with revenue going in reverse. There's potential for the P/S to fall to even lower levels if the company doesn't improve its top-line growth.
What Does Liqun Commercial GroupLtd's P/S Mean For Investors?
Liqun Commercial GroupLtd's stock price has surged recently, but its but its P/S still remains modest. We'd say the price-to-sales ratio's power isn't primarily as a valuation instrument but rather to gauge current investor sentiment and future expectations.
It's no surprise that Liqun Commercial GroupLtd maintains its low P/S off the back of its sliding revenue over the medium-term. At this stage investors feel the potential for an improvement in revenue isn't great enough to justify a higher P/S ratio. Given the current circumstances, it seems unlikely that the share price will experience any significant movement in either direction in the near future if recent medium-term revenue trends persist.
You need to take note of risks, for example - Liqun Commercial GroupLtd has 3 warning signs (and 2 which are a bit concerning) we think you should know about.
If companies with solid past earnings growth is up your alley, you may wish to see this free collection of other companies with strong earnings growth and low P/E ratios.
If you're looking to trade Liqun Commercial GroupLtd, open an account with the lowest-cost platform trusted by professionals, Interactive Brokers.
With clients in over 200 countries and territories, and access to 160 markets, IBKR lets you trade stocks, options, futures, forex, bonds and funds from a single integrated account.
Enjoy no hidden fees, no account minimums, and FX conversion rates as low as 0.03%, far better than what most brokers offer.
Sponsored ContentNew: AI Stock Screener & Alerts
Our new AI Stock Screener scans the market every day to uncover opportunities.
• Dividend Powerhouses (3%+ Yield)
• Undervalued Small Caps with Insider Buying
• High growth Tech and AI Companies
Or build your own from over 50 metrics.
Have feedback on this article? Concerned about the content? Get in touch with us directly. Alternatively, email editorial-team (at) simplywallst.com.
This article by Simply Wall St is general in nature. We provide commentary based on historical data and analyst forecasts only using an unbiased methodology and our articles are not intended to be financial advice. It does not constitute a recommendation to buy or sell any stock, and does not take account of your objectives, or your financial situation. We aim to bring you long-term focused analysis driven by fundamental data. Note that our analysis may not factor in the latest price-sensitive company announcements or qualitative material. Simply Wall St has no position in any stocks mentioned.
About SHSE:601366
Liqun Commercial GroupLtd
Engages in the commercial retail chain business in China.
Low and slightly overvalued.
Market Insights

Community Narratives


