- China
- /
- Specialty Stores
- /
- SHSE:600297
China Grand Automotive Services GroupLtd (SHSE:600297) Will Be Looking To Turn Around Its Returns


When we're researching a company, it's sometimes hard to find the warning signs, but there are some financial metrics that can help spot trouble early. Typically, we'll see the trend of both return on capital employed (ROCE) declining and this usually coincides with a decreasing amount of capital employed. This indicates the company is producing less profit from its investments and its total assets are decreasing. And from a first read, things don't look too good at China Grand Automotive Services GroupLtd (SHSE:600297), so let's see why.
Return On Capital Employed (ROCE): What Is It?
For those that aren't sure what ROCE is, it measures the amount of pre-tax profits a company can generate from the capital employed in its business. To calculate this metric for China Grand Automotive Services GroupLtd, this is the formula:
Return on Capital Employed = Earnings Before Interest and Tax (EBIT) ÷ (Total Assets - Current Liabilities)
0.05 = CN¥2.9b ÷ (CN¥112b - CN¥53b) (Based on the trailing twelve months to March 2024).
Thus, China Grand Automotive Services GroupLtd has an ROCE of 5.0%. In absolute terms, that's a low return but it's around the Specialty Retail industry average of 4.3%.
View our latest analysis for China Grand Automotive Services GroupLtd
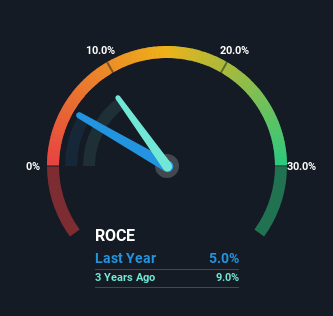
Above you can see how the current ROCE for China Grand Automotive Services GroupLtd compares to its prior returns on capital, but there's only so much you can tell from the past. If you'd like to see what analysts are forecasting going forward, you should check out our free analyst report for China Grand Automotive Services GroupLtd .
How Are Returns Trending?
We are a bit worried about the trend of returns on capital at China Grand Automotive Services GroupLtd. To be more specific, the ROCE was 11% five years ago, but since then it has dropped noticeably. Meanwhile, capital employed in the business has stayed roughly the flat over the period. This combination can be indicative of a mature business that still has areas to deploy capital, but the returns received aren't as high due potentially to new competition or smaller margins. So because these trends aren't typically conducive to creating a multi-bagger, we wouldn't hold our breath on China Grand Automotive Services GroupLtd becoming one if things continue as they have.
Another thing to note, China Grand Automotive Services GroupLtd has a high ratio of current liabilities to total assets of 48%. This can bring about some risks because the company is basically operating with a rather large reliance on its suppliers or other sorts of short-term creditors. Ideally we'd like to see this reduce as that would mean fewer obligations bearing risks.
The Bottom Line
In the end, the trend of lower returns on the same amount of capital isn't typically an indication that we're looking at a growth stock. Long term shareholders who've owned the stock over the last five years have experienced a 70% depreciation in their investment, so it appears the market might not like these trends either. That being the case, unless the underlying trends revert to a more positive trajectory, we'd consider looking elsewhere.
If you'd like to know about the risks facing China Grand Automotive Services GroupLtd, we've discovered 1 warning sign that you should be aware of.
If you want to search for solid companies with great earnings, check out this free list of companies with good balance sheets and impressive returns on equity.
If you're looking to trade China Grand Automotive Services GroupLtd, open an account with the lowest-cost platform trusted by professionals, Interactive Brokers.
With clients in over 200 countries and territories, and access to 160 markets, IBKR lets you trade stocks, options, futures, forex, bonds and funds from a single integrated account.
Enjoy no hidden fees, no account minimums, and FX conversion rates as low as 0.03%, far better than what most brokers offer.
Sponsored ContentNew: AI Stock Screener & Alerts
Our new AI Stock Screener scans the market every day to uncover opportunities.
• Dividend Powerhouses (3%+ Yield)
• Undervalued Small Caps with Insider Buying
• High growth Tech and AI Companies
Or build your own from over 50 metrics.
Have feedback on this article? Concerned about the content? Get in touch with us directly. Alternatively, email editorial-team (at) simplywallst.com.
This article by Simply Wall St is general in nature. We provide commentary based on historical data and analyst forecasts only using an unbiased methodology and our articles are not intended to be financial advice. It does not constitute a recommendation to buy or sell any stock, and does not take account of your objectives, or your financial situation. We aim to bring you long-term focused analysis driven by fundamental data. Note that our analysis may not factor in the latest price-sensitive company announcements or qualitative material. Simply Wall St has no position in any stocks mentioned.
About SHSE:600297
China Grand Automotive Services GroupLtd
Engages in luxury passenger car distribution and services in China.
Undervalued slight.
Similar Companies
Market Insights

Community Narratives


