- China
- /
- Real Estate
- /
- SZSE:000736
The Market Lifts CCCG Real Estate Company Limited (SZSE:000736) Shares 71% But It Can Do More


CCCG Real Estate Company Limited (SZSE:000736) shares have had a really impressive month, gaining 71% after a shaky period beforehand. Unfortunately, despite the strong performance over the last month, the full year gain of 3.2% isn't as attractive.
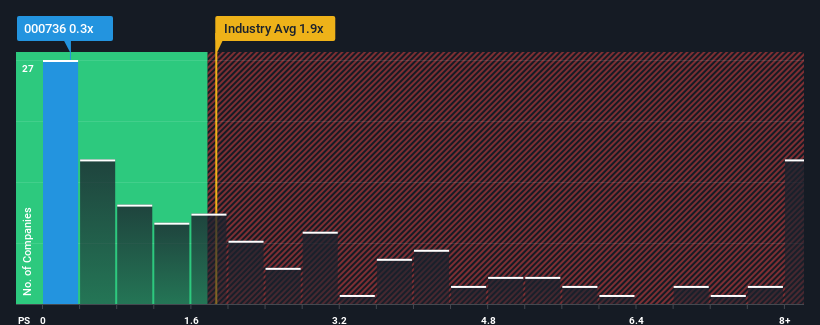
Although its price has surged higher, CCCG Real Estate's price-to-sales (or "P/S") ratio of 0.3x might still make it look like a buy right now compared to the Real Estate industry in China, where around half of the companies have P/S ratios above 1.9x and even P/S above 5x are quite common. Nonetheless, we'd need to dig a little deeper to determine if there is a rational basis for the reduced P/S.
View our latest analysis for CCCG Real Estate
What Does CCCG Real Estate's P/S Mean For Shareholders?
For example, consider that CCCG Real Estate's financial performance has been poor lately as its revenue has been in decline. It might be that many expect the disappointing revenue performance to continue or accelerate, which has repressed the P/S. If you like the company, you'd be hoping this isn't the case so that you could potentially pick up some stock while it's out of favour.
Want the full picture on earnings, revenue and cash flow for the company? Then our free report on CCCG Real Estate will help you shine a light on its historical performance.What Are Revenue Growth Metrics Telling Us About The Low P/S?
The only time you'd be truly comfortable seeing a P/S as low as CCCG Real Estate's is when the company's growth is on track to lag the industry.
Retrospectively, the last year delivered a frustrating 6.0% decrease to the company's top line. Even so, admirably revenue has lifted 191% in aggregate from three years ago, notwithstanding the last 12 months. Accordingly, while they would have preferred to keep the run going, shareholders would definitely welcome the medium-term rates of revenue growth.
Comparing that recent medium-term revenue trajectory with the industry's one-year growth forecast of 11% shows it's noticeably more attractive.
In light of this, it's peculiar that CCCG Real Estate's P/S sits below the majority of other companies. It looks like most investors are not convinced the company can maintain its recent growth rates.
The Key Takeaway
Despite CCCG Real Estate's share price climbing recently, its P/S still lags most other companies. Typically, we'd caution against reading too much into price-to-sales ratios when settling on investment decisions, though it can reveal plenty about what other market participants think about the company.
Our examination of CCCG Real Estate revealed its three-year revenue trends aren't boosting its P/S anywhere near as much as we would have predicted, given they look better than current industry expectations. Potential investors that are sceptical over continued revenue performance may be preventing the P/S ratio from matching previous strong performance. At least price risks look to be very low if recent medium-term revenue trends continue, but investors seem to think future revenue could see a lot of volatility.
It is also worth noting that we have found 4 warning signs for CCCG Real Estate (3 are potentially serious!) that you need to take into consideration.
If these risks are making you reconsider your opinion on CCCG Real Estate, explore our interactive list of high quality stocks to get an idea of what else is out there.
New: AI Stock Screener & Alerts
Our new AI Stock Screener scans the market every day to uncover opportunities.
• Dividend Powerhouses (3%+ Yield)
• Undervalued Small Caps with Insider Buying
• High growth Tech and AI Companies
Or build your own from over 50 metrics.
Have feedback on this article? Concerned about the content? Get in touch with us directly. Alternatively, email editorial-team (at) simplywallst.com.
This article by Simply Wall St is general in nature. We provide commentary based on historical data and analyst forecasts only using an unbiased methodology and our articles are not intended to be financial advice. It does not constitute a recommendation to buy or sell any stock, and does not take account of your objectives, or your financial situation. We aim to bring you long-term focused analysis driven by fundamental data. Note that our analysis may not factor in the latest price-sensitive company announcements or qualitative material. Simply Wall St has no position in any stocks mentioned.
About SZSE:000736
CCCG Real Estate
Develops, operates, and sells real estate properties in China.
Excellent balance sheet and slightly overvalued.
Market Insights

Community Narratives


