- China
- /
- Real Estate
- /
- SZSE:000402
Are Financial Street Holdings Co., Ltd. (SZSE:000402) Investors Paying Above The Intrinsic Value?


Key Insights
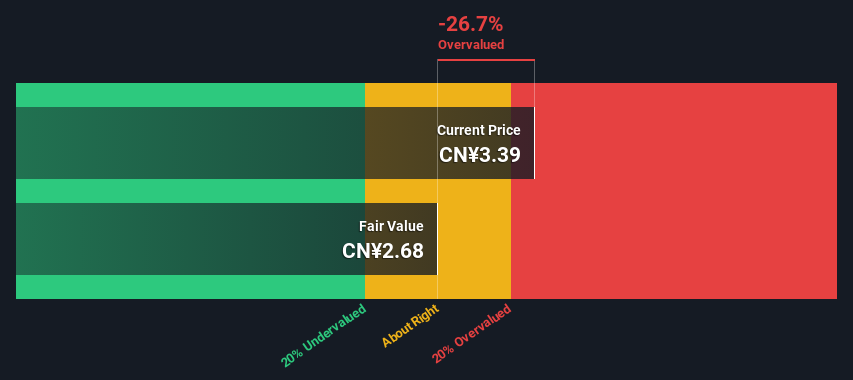
- Using the 2 Stage Free Cash Flow to Equity, Financial Street Holdings fair value estimate is CN¥2.68
- Financial Street Holdings is estimated to be 27% overvalued based on current share price of CN¥3.39
- Analyst price target for 402 is CN¥4.29, which is 60% above our fair value estimate
Today we will run through one way of estimating the intrinsic value of Financial Street Holdings Co., Ltd. (SZSE:000402) by estimating the company's future cash flows and discounting them to their present value. The Discounted Cash Flow (DCF) model is the tool we will apply to do this. It may sound complicated, but actually it is quite simple!
Remember though, that there are many ways to estimate a company's value, and a DCF is just one method. Anyone interested in learning a bit more about intrinsic value should have a read of the Simply Wall St analysis model.
Check out our latest analysis for Financial Street Holdings
What's The Estimated Valuation?
We're using the 2-stage growth model, which simply means we take in account two stages of company's growth. In the initial period the company may have a higher growth rate and the second stage is usually assumed to have a stable growth rate. To begin with, we have to get estimates of the next ten years of cash flows. Seeing as no analyst estimates of free cash flow are available to us, we have extrapolate the previous free cash flow (FCF) from the company's last reported value. We assume companies with shrinking free cash flow will slow their rate of shrinkage, and that companies with growing free cash flow will see their growth rate slow, over this period. We do this to reflect that growth tends to slow more in the early years than it does in later years.
A DCF is all about the idea that a dollar in the future is less valuable than a dollar today, so we need to discount the sum of these future cash flows to arrive at a present value estimate:
10-year free cash flow (FCF) forecast
| 2024 | 2025 | 2026 | 2027 | 2028 | 2029 | 2030 | 2031 | 2032 | 2033 | |
| Levered FCF (CN¥, Millions) | CN¥2.17b | CN¥1.44b | CN¥1.11b | CN¥944.4m | CN¥853.1m | CN¥802.8m | CN¥776.6m | CN¥765.6m | CN¥764.7m | CN¥770.8m |
| Growth Rate Estimate Source | Est @ -49.45% | Est @ -33.74% | Est @ -22.75% | Est @ -15.05% | Est @ -9.67% | Est @ -5.90% | Est @ -3.26% | Est @ -1.41% | Est @ -0.12% | Est @ 0.79% |
| Present Value (CN¥, Millions) Discounted @ 14% | CN¥1.9k | CN¥1.1k | CN¥747 | CN¥556 | CN¥440 | CN¥363 | CN¥307 | CN¥265 | CN¥232 | CN¥205 |
("Est" = FCF growth rate estimated by Simply Wall St)
Present Value of 10-year Cash Flow (PVCF) = CN¥6.1b
The second stage is also known as Terminal Value, this is the business's cash flow after the first stage. For a number of reasons a very conservative growth rate is used that cannot exceed that of a country's GDP growth. In this case we have used the 5-year average of the 10-year government bond yield (2.9%) to estimate future growth. In the same way as with the 10-year 'growth' period, we discount future cash flows to today's value, using a cost of equity of 14%.
Terminal Value (TV)= FCF2033 × (1 + g) ÷ (r – g) = CN¥771m× (1 + 2.9%) ÷ (14%– 2.9%) = CN¥7.0b
Present Value of Terminal Value (PVTV)= TV / (1 + r)10= CN¥7.0b÷ ( 1 + 14%)10= CN¥1.9b
The total value, or equity value, is then the sum of the present value of the future cash flows, which in this case is CN¥8.0b. To get the intrinsic value per share, we divide this by the total number of shares outstanding. Compared to the current share price of CN¥3.4, the company appears slightly overvalued at the time of writing. Remember though, that this is just an approximate valuation, and like any complex formula - garbage in, garbage out.
The Assumptions
We would point out that the most important inputs to a discounted cash flow are the discount rate and of course the actual cash flows. If you don't agree with these result, have a go at the calculation yourself and play with the assumptions. The DCF also does not consider the possible cyclicality of an industry, or a company's future capital requirements, so it does not give a full picture of a company's potential performance. Given that we are looking at Financial Street Holdings as potential shareholders, the cost of equity is used as the discount rate, rather than the cost of capital (or weighted average cost of capital, WACC) which accounts for debt. In this calculation we've used 14%, which is based on a levered beta of 2.000. Beta is a measure of a stock's volatility, compared to the market as a whole. We get our beta from the industry average beta of globally comparable companies, with an imposed limit between 0.8 and 2.0, which is a reasonable range for a stable business.
SWOT Analysis for Financial Street Holdings
- No major strengths identified for 000402.
- Expensive based on P/S ratio and estimated fair value.
- Expected to breakeven next year.
- Has sufficient cash runway for more than 3 years based on current free cash flows.
- Debt is not well covered by operating cash flow.
Moving On:
Valuation is only one side of the coin in terms of building your investment thesis, and it ideally won't be the sole piece of analysis you scrutinize for a company. DCF models are not the be-all and end-all of investment valuation. Rather it should be seen as a guide to "what assumptions need to be true for this stock to be under/overvalued?" For instance, if the terminal value growth rate is adjusted slightly, it can dramatically alter the overall result. What is the reason for the share price exceeding the intrinsic value? For Financial Street Holdings, we've compiled three essential factors you should further research:
- Risks: Every company has them, and we've spotted 1 warning sign for Financial Street Holdings you should know about.
- Future Earnings: How does 000402's growth rate compare to its peers and the wider market? Dig deeper into the analyst consensus number for the upcoming years by interacting with our free analyst growth expectation chart.
- Other High Quality Alternatives: Do you like a good all-rounder? Explore our interactive list of high quality stocks to get an idea of what else is out there you may be missing!
PS. Simply Wall St updates its DCF calculation for every Chinese stock every day, so if you want to find the intrinsic value of any other stock just search here.
New: AI Stock Screener & Alerts
Our new AI Stock Screener scans the market every day to uncover opportunities.
• Dividend Powerhouses (3%+ Yield)
• Undervalued Small Caps with Insider Buying
• High growth Tech and AI Companies
Or build your own from over 50 metrics.
Have feedback on this article? Concerned about the content? Get in touch with us directly. Alternatively, email editorial-team (at) simplywallst.com.
This article by Simply Wall St is general in nature. We provide commentary based on historical data and analyst forecasts only using an unbiased methodology and our articles are not intended to be financial advice. It does not constitute a recommendation to buy or sell any stock, and does not take account of your objectives, or your financial situation. We aim to bring you long-term focused analysis driven by fundamental data. Note that our analysis may not factor in the latest price-sensitive company announcements or qualitative material. Simply Wall St has no position in any stocks mentioned.
About SZSE:000402
Financial Street Holdings
Engages in the development and operation of real estate properties in China.
Good value with mediocre balance sheet.
Market Insights

Community Narratives


