
Advertisement
Luoxin Pharmaceuticals Group Stock Co., Ltd.'s (SZSE:002793) Price Is Right But Growth Is Lacking After Shares Rocket 25%

The Luoxin Pharmaceuticals Group Stock Co., Ltd. (SZSE:002793) share price has done very well over the last month, posting an excellent gain of 25%. Not all shareholders will be feeling jubilant, since the share price is still down a very disappointing 26% in the last twelve months.
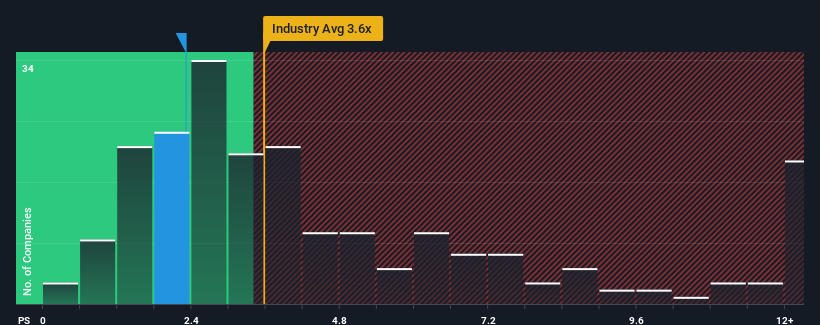
Even after such a large jump in price, Luoxin Pharmaceuticals Group Stock's price-to-sales (or "P/S") ratio of 2.3x might still make it look like a buy right now compared to the Pharmaceuticals industry in China, where around half of the companies have P/S ratios above 3.6x and even P/S above 7x are quite common. Nonetheless, we'd need to dig a little deeper to determine if there is a rational basis for the reduced P/S.
View our latest analysis for Luoxin Pharmaceuticals Group Stock
How Has Luoxin Pharmaceuticals Group Stock Performed Recently?
Luoxin Pharmaceuticals Group Stock has been doing a good job lately as it's been growing revenue at a solid pace. One possibility is that the P/S is low because investors think this respectable revenue growth might actually underperform the broader industry in the near future. If you like the company, you'd be hoping this isn't the case so that you could potentially pick up some stock while it's out of favour.
Although there are no analyst estimates available for Luoxin Pharmaceuticals Group Stock, take a look at this free data-rich visualisation to see how the company stacks up on earnings, revenue and cash flow.Do Revenue Forecasts Match The Low P/S Ratio?
The only time you'd be truly comfortable seeing a P/S as low as Luoxin Pharmaceuticals Group Stock's is when the company's growth is on track to lag the industry.
Retrospectively, the last year delivered an exceptional 15% gain to the company's top line. Despite this strong recent growth, it's still struggling to catch up as its three-year revenue frustratingly shrank by 64% overall. Accordingly, shareholders would have felt downbeat about the medium-term rates of revenue growth.
Weighing that medium-term revenue trajectory against the broader industry's one-year forecast for expansion of 19% shows it's an unpleasant look.
With this information, we are not surprised that Luoxin Pharmaceuticals Group Stock is trading at a P/S lower than the industry. However, we think shrinking revenues are unlikely to lead to a stable P/S over the longer term, which could set up shareholders for future disappointment. There's potential for the P/S to fall to even lower levels if the company doesn't improve its top-line growth.
The Key Takeaway
Luoxin Pharmaceuticals Group Stock's stock price has surged recently, but its but its P/S still remains modest. Generally, our preference is to limit the use of the price-to-sales ratio to establishing what the market thinks about the overall health of a company.
It's no surprise that Luoxin Pharmaceuticals Group Stock maintains its low P/S off the back of its sliding revenue over the medium-term. Right now shareholders are accepting the low P/S as they concede future revenue probably won't provide any pleasant surprises either. Given the current circumstances, it seems unlikely that the share price will experience any significant movement in either direction in the near future if recent medium-term revenue trends persist.
And what about other risks? Every company has them, and we've spotted 2 warning signs for Luoxin Pharmaceuticals Group Stock (of which 1 is concerning!) you should know about.
If strong companies turning a profit tickle your fancy, then you'll want to check out this free list of interesting companies that trade on a low P/E (but have proven they can grow earnings).
New: AI Stock Screener & Alerts
Our new AI Stock Screener scans the market every day to uncover opportunities.
• Dividend Powerhouses (3%+ Yield)
• Undervalued Small Caps with Insider Buying
• High growth Tech and AI Companies
Or build your own from over 50 metrics.
Have feedback on this article? Concerned about the content? Get in touch with us directly. Alternatively, email editorial-team (at) simplywallst.com.
This article by Simply Wall St is general in nature. We provide commentary based on historical data and analyst forecasts only using an unbiased methodology and our articles are not intended to be financial advice. It does not constitute a recommendation to buy or sell any stock, and does not take account of your objectives, or your financial situation. We aim to bring you long-term focused analysis driven by fundamental data. Note that our analysis may not factor in the latest price-sensitive company announcements or qualitative material. Simply Wall St has no position in any stocks mentioned.
About SZSE:002793
Luoxin Pharmaceuticals Group Stock
Luoxin Pharmaceuticals Group Stock Co., Ltd.
Slightly overvalued very low.
Market Insights

Advertisement
Community Narratives

Apple: A Dying Star with an Overpriced Valuation
Fair Value US$177.34|17.7% overvalued
IN
Community Contributor
Avino a case for USD$20 per share within 5 years (assuming $3,500 gold, $100 silver and $4 copper).
Fair Value CA$26.79|86.0% undervalued
AG
Community Contributor
Riding the Defense Boom RENK Sees Revenue Climb at 15% CAGR by FY 2029
Fair Value €69.87|11.0% undervalued
CH
Community Contributor