Here's Why Shenzhen Hepalink Pharmaceutical Group (SZSE:002399) Can Afford Some Debt


Some say volatility, rather than debt, is the best way to think about risk as an investor, but Warren Buffett famously said that 'Volatility is far from synonymous with risk.' So it might be obvious that you need to consider debt, when you think about how risky any given stock is, because too much debt can sink a company. As with many other companies Shenzhen Hepalink Pharmaceutical Group Co., Ltd. (SZSE:002399) makes use of debt. But should shareholders be worried about its use of debt?
When Is Debt A Problem?
Debt and other liabilities become risky for a business when it cannot easily fulfill those obligations, either with free cash flow or by raising capital at an attractive price. Ultimately, if the company can't fulfill its legal obligations to repay debt, shareholders could walk away with nothing. However, a more frequent (but still costly) occurrence is where a company must issue shares at bargain-basement prices, permanently diluting shareholders, just to shore up its balance sheet. Of course, the upside of debt is that it often represents cheap capital, especially when it replaces dilution in a company with the ability to reinvest at high rates of return. When we examine debt levels, we first consider both cash and debt levels, together.
See our latest analysis for Shenzhen Hepalink Pharmaceutical Group
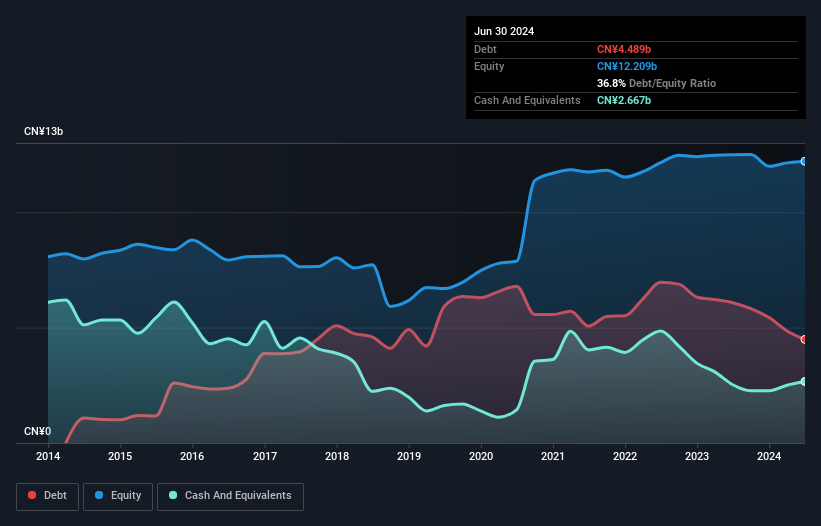
What Is Shenzhen Hepalink Pharmaceutical Group's Debt?
The image below, which you can click on for greater detail, shows that Shenzhen Hepalink Pharmaceutical Group had debt of CN¥4.49b at the end of June 2024, a reduction from CN¥6.08b over a year. However, it also had CN¥2.67b in cash, and so its net debt is CN¥1.82b.
How Healthy Is Shenzhen Hepalink Pharmaceutical Group's Balance Sheet?
We can see from the most recent balance sheet that Shenzhen Hepalink Pharmaceutical Group had liabilities of CN¥4.48b falling due within a year, and liabilities of CN¥1.88b due beyond that. Offsetting this, it had CN¥2.67b in cash and CN¥1.67b in receivables that were due within 12 months. So it has liabilities totalling CN¥2.02b more than its cash and near-term receivables, combined.
Given Shenzhen Hepalink Pharmaceutical Group has a market capitalization of CN¥15.2b, it's hard to believe these liabilities pose much threat. But there are sufficient liabilities that we would certainly recommend shareholders continue to monitor the balance sheet, going forward. When analysing debt levels, the balance sheet is the obvious place to start. But ultimately the future profitability of the business will decide if Shenzhen Hepalink Pharmaceutical Group can strengthen its balance sheet over time. So if you're focused on the future you can check out this free report showing analyst profit forecasts.
Over 12 months, Shenzhen Hepalink Pharmaceutical Group made a loss at the EBIT level, and saw its revenue drop to CN¥5.6b, which is a fall of 8.9%. That's not what we would hope to see.
Caveat Emptor
Over the last twelve months Shenzhen Hepalink Pharmaceutical Group produced an earnings before interest and tax (EBIT) loss. To be specific the EBIT loss came in at CN¥36m. Considering that alongside the liabilities mentioned above does not give us much confidence that company should be using so much debt. Quite frankly we think the balance sheet is far from match-fit, although it could be improved with time. For example, we would not want to see a repeat of last year's loss of CN¥243m. In the meantime, we consider the stock very risky. When we look at a riskier company, we like to check how their profits (or losses) are trending over time. Today, we're providing readers this interactive graph showing how Shenzhen Hepalink Pharmaceutical Group's profit, revenue, and operating cashflow have changed over the last few years.
If you're interested in investing in businesses that can grow profits without the burden of debt, then check out this free list of growing businesses that have net cash on the balance sheet.
New: Manage All Your Stock Portfolios in One Place
We've created the ultimate portfolio companion for stock investors, and it's free.
• Connect an unlimited number of Portfolios and see your total in one currency
• Be alerted to new Warning Signs or Risks via email or mobile
• Track the Fair Value of your stocks
Have feedback on this article? Concerned about the content? Get in touch with us directly. Alternatively, email editorial-team (at) simplywallst.com.
This article by Simply Wall St is general in nature. We provide commentary based on historical data and analyst forecasts only using an unbiased methodology and our articles are not intended to be financial advice. It does not constitute a recommendation to buy or sell any stock, and does not take account of your objectives, or your financial situation. We aim to bring you long-term focused analysis driven by fundamental data. Note that our analysis may not factor in the latest price-sensitive company announcements or qualitative material. Simply Wall St has no position in any stocks mentioned.
About SZSE:002399
Shenzhen Hepalink Pharmaceutical Group
Shenzhen Hepalink Pharmaceutical Group Co., Ltd.
Flawless balance sheet average dividend payer.
Market Insights

Community Narratives
