
Advertisement
Zhejiang Shengda Bio-Pharm Co., Ltd.'s (SHSE:603079) 30% Dip In Price Shows Sentiment Is Matching Revenues

Zhejiang Shengda Bio-Pharm Co., Ltd. (SHSE:603079) shareholders that were waiting for something to happen have been dealt a blow with a 30% share price drop in the last month. The drop over the last 30 days has capped off a tough year for shareholders, with the share price down 20% in that time.
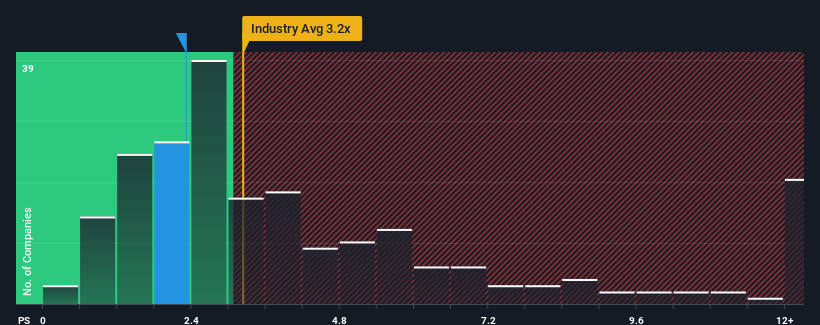
Following the heavy fall in price, Zhejiang Shengda Bio-Pharm may be sending buy signals at present with its price-to-sales (or "P/S") ratio of 2.3x, considering almost half of all companies in the Pharmaceuticals industry in China have P/S ratios greater than 3.2x and even P/S higher than 6x aren't out of the ordinary. Nonetheless, we'd need to dig a little deeper to determine if there is a rational basis for the reduced P/S.
View our latest analysis for Zhejiang Shengda Bio-Pharm
What Does Zhejiang Shengda Bio-Pharm's Recent Performance Look Like?
For example, consider that Zhejiang Shengda Bio-Pharm's financial performance has been poor lately as its revenue has been in decline. One possibility is that the P/S is low because investors think the company won't do enough to avoid underperforming the broader industry in the near future. However, if this doesn't eventuate then existing shareholders may be feeling optimistic about the future direction of the share price.
We don't have analyst forecasts, but you can see how recent trends are setting up the company for the future by checking out our free report on Zhejiang Shengda Bio-Pharm's earnings, revenue and cash flow.Do Revenue Forecasts Match The Low P/S Ratio?
The only time you'd be truly comfortable seeing a P/S as low as Zhejiang Shengda Bio-Pharm's is when the company's growth is on track to lag the industry.
In reviewing the last year of financials, we were disheartened to see the company's revenues fell to the tune of 1.4%. As a result, revenue from three years ago have also fallen 16% overall. Accordingly, shareholders would have felt downbeat about the medium-term rates of revenue growth.
Comparing that to the industry, which is predicted to deliver 44% growth in the next 12 months, the company's downward momentum based on recent medium-term revenue results is a sobering picture.
With this in mind, we understand why Zhejiang Shengda Bio-Pharm's P/S is lower than most of its industry peers. Nonetheless, there's no guarantee the P/S has reached a floor yet with revenue going in reverse. There's potential for the P/S to fall to even lower levels if the company doesn't improve its top-line growth.
The Final Word
The southerly movements of Zhejiang Shengda Bio-Pharm's shares means its P/S is now sitting at a pretty low level. Using the price-to-sales ratio alone to determine if you should sell your stock isn't sensible, however it can be a practical guide to the company's future prospects.
Our examination of Zhejiang Shengda Bio-Pharm confirms that the company's shrinking revenue over the past medium-term is a key factor in its low price-to-sales ratio, given the industry is projected to grow. At this stage investors feel the potential for an improvement in revenue isn't great enough to justify a higher P/S ratio. If recent medium-term revenue trends continue, it's hard to see the share price moving strongly in either direction in the near future under these circumstances.
And what about other risks? Every company has them, and we've spotted 2 warning signs for Zhejiang Shengda Bio-Pharm (of which 1 is potentially serious!) you should know about.
If strong companies turning a profit tickle your fancy, then you'll want to check out this free list of interesting companies that trade on a low P/E (but have proven they can grow earnings).
Valuation is complex, but we're here to simplify it.
Discover if Zhejiang Shengda Bio-Pharm might be undervalued or overvalued with our detailed analysis, featuring fair value estimates, potential risks, dividends, insider trades, and its financial condition.
Access Free AnalysisHave feedback on this article? Concerned about the content? Get in touch with us directly. Alternatively, email editorial-team (at) simplywallst.com.
This article by Simply Wall St is general in nature. We provide commentary based on historical data and analyst forecasts only using an unbiased methodology and our articles are not intended to be financial advice. It does not constitute a recommendation to buy or sell any stock, and does not take account of your objectives, or your financial situation. We aim to bring you long-term focused analysis driven by fundamental data. Note that our analysis may not factor in the latest price-sensitive company announcements or qualitative material. Simply Wall St has no position in any stocks mentioned.
About SHSE:603079
Zhejiang Shengda Bio-Pharm
Develops, produces, and sells food and feed additives for pharmaceutical, nutritional, food, and animal feed industry.
Excellent balance sheet and overvalued.
Market Insights

Advertisement
Community Narratives
RIO is poised to weather a depressed iron ore environment, but commodity diversification comes with lower margins
Fair Value AU$110.51|4.0% overvalued
DU
Community Contributor
The demand for personalized medicine will keep Thermo Fisher Scientific thriving
Fair Value US$540.27|20.1% undervalued
UN
Community Contributor
Silver Play by A Family with 10x Potential
Fair Value UK£24.00|88.7% undervalued
RO
Community Contributor