Changzhou Tiansheng New Materials Group Co., Ltd.'s (SZSE:300169) Popularity With Investors Under Threat As Stock Sinks 32%


Unfortunately for some shareholders, the Changzhou Tiansheng New Materials Group Co., Ltd. (SZSE:300169) share price has dived 32% in the last thirty days, prolonging recent pain. The last month has meant the stock is now only up 6.0% during the last year.
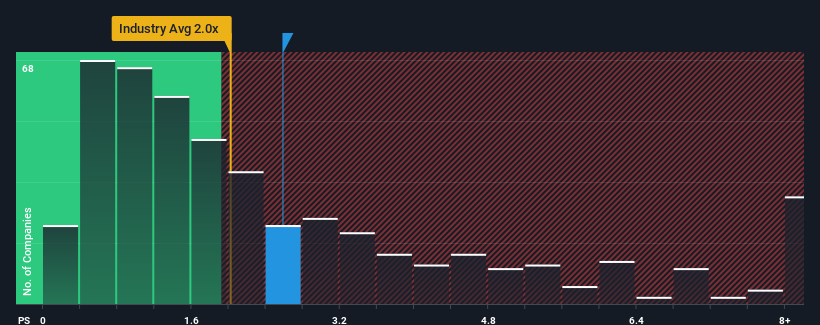
Even after such a large drop in price, given close to half the companies operating in China's Chemicals industry have price-to-sales ratios (or "P/S") below 2x, you may still consider Changzhou Tiansheng New Materials Group as a stock to potentially avoid with its 2.6x P/S ratio. Nonetheless, we'd need to dig a little deeper to determine if there is a rational basis for the elevated P/S.
See our latest analysis for Changzhou Tiansheng New Materials Group
How Has Changzhou Tiansheng New Materials Group Performed Recently?
For example, consider that Changzhou Tiansheng New Materials Group's financial performance has been poor lately as its revenue has been in decline. One possibility is that the P/S is high because investors think the company will still do enough to outperform the broader industry in the near future. You'd really hope so, otherwise you're paying a pretty hefty price for no particular reason.
Want the full picture on earnings, revenue and cash flow for the company? Then our free report on Changzhou Tiansheng New Materials Group will help you shine a light on its historical performance.What Are Revenue Growth Metrics Telling Us About The High P/S?
Changzhou Tiansheng New Materials Group's P/S ratio would be typical for a company that's expected to deliver solid growth, and importantly, perform better than the industry.
Retrospectively, the last year delivered a frustrating 10% decrease to the company's top line. The last three years don't look nice either as the company has shrunk revenue by 42% in aggregate. Therefore, it's fair to say the revenue growth recently has been undesirable for the company.
In contrast to the company, the rest of the industry is expected to grow by 20% over the next year, which really puts the company's recent medium-term revenue decline into perspective.
In light of this, it's alarming that Changzhou Tiansheng New Materials Group's P/S sits above the majority of other companies. Apparently many investors in the company are way more bullish than recent times would indicate and aren't willing to let go of their stock at any price. Only the boldest would assume these prices are sustainable as a continuation of recent revenue trends is likely to weigh heavily on the share price eventually.
The Key Takeaway
Changzhou Tiansheng New Materials Group's P/S remain high even after its stock plunged. While the price-to-sales ratio shouldn't be the defining factor in whether you buy a stock or not, it's quite a capable barometer of revenue expectations.
We've established that Changzhou Tiansheng New Materials Group currently trades on a much higher than expected P/S since its recent revenues have been in decline over the medium-term. With a revenue decline on investors' minds, the likelihood of a souring sentiment is quite high which could send the P/S back in line with what we'd expect. If recent medium-term revenue trends continue, it will place shareholders' investments at significant risk and potential investors in danger of paying an excessive premium.
And what about other risks? Every company has them, and we've spotted 2 warning signs for Changzhou Tiansheng New Materials Group you should know about.
If companies with solid past earnings growth is up your alley, you may wish to see this free collection of other companies with strong earnings growth and low P/E ratios.
If you're looking to trade Changzhou Tiansheng New Materials Group, open an account with the lowest-cost platform trusted by professionals, Interactive Brokers.
With clients in over 200 countries and territories, and access to 160 markets, IBKR lets you trade stocks, options, futures, forex, bonds and funds from a single integrated account.
Enjoy no hidden fees, no account minimums, and FX conversion rates as low as 0.03%, far better than what most brokers offer.
Sponsored ContentNew: AI Stock Screener & Alerts
Our new AI Stock Screener scans the market every day to uncover opportunities.
• Dividend Powerhouses (3%+ Yield)
• Undervalued Small Caps with Insider Buying
• High growth Tech and AI Companies
Or build your own from over 50 metrics.
Have feedback on this article? Concerned about the content? Get in touch with us directly. Alternatively, email editorial-team (at) simplywallst.com.
This article by Simply Wall St is general in nature. We provide commentary based on historical data and analyst forecasts only using an unbiased methodology and our articles are not intended to be financial advice. It does not constitute a recommendation to buy or sell any stock, and does not take account of your objectives, or your financial situation. We aim to bring you long-term focused analysis driven by fundamental data. Note that our analysis may not factor in the latest price-sensitive company announcements or qualitative material. Simply Wall St has no position in any stocks mentioned.
About SZSE:300169
Changzhou Tiansheng New Materials Group
Engages in the research and development, production, and sale of polymer foam materials in China.
Mediocre balance sheet minimal.
Market Insights

Community Narratives


