
Advertisement
A Look At The Intrinsic Value Of Luyang Energy-Saving Materials Co., Ltd. (SZSE:002088)
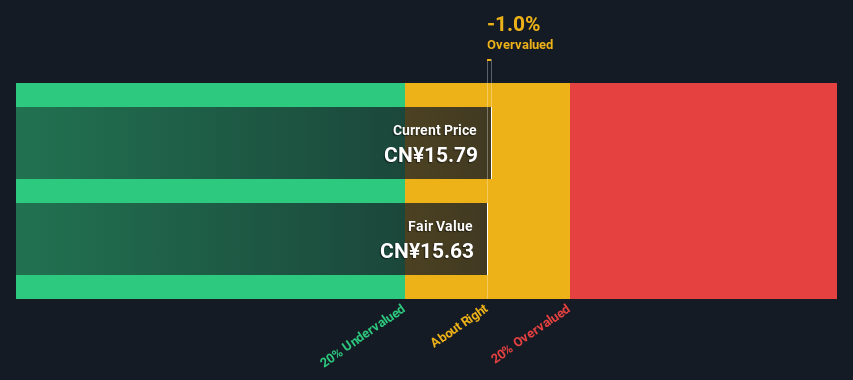
Key Insights
- The projected fair value for Luyang Energy-Saving Materials is CN¥15.63 based on 2 Stage Free Cash Flow to Equity
- Current share price of CN¥15.79 suggests Luyang Energy-Saving Materials is potentially trading close to its fair value
- Our fair value estimate is 30% lower than Luyang Energy-Saving Materials' analyst price target of CN¥22.33
How far off is Luyang Energy-Saving Materials Co., Ltd. (SZSE:002088) from its intrinsic value? Using the most recent financial data, we'll take a look at whether the stock is fairly priced by projecting its future cash flows and then discounting them to today's value. This will be done using the Discounted Cash Flow (DCF) model. Believe it or not, it's not too difficult to follow, as you'll see from our example!
Companies can be valued in a lot of ways, so we would point out that a DCF is not perfect for every situation. Anyone interested in learning a bit more about intrinsic value should have a read of the Simply Wall St analysis model.
View our latest analysis for Luyang Energy-Saving Materials
The Method
We're using the 2-stage growth model, which simply means we take in account two stages of company's growth. In the initial period the company may have a higher growth rate and the second stage is usually assumed to have a stable growth rate. To start off with, we need to estimate the next ten years of cash flows. Seeing as no analyst estimates of free cash flow are available to us, we have extrapolate the previous free cash flow (FCF) from the company's last reported value. We assume companies with shrinking free cash flow will slow their rate of shrinkage, and that companies with growing free cash flow will see their growth rate slow, over this period. We do this to reflect that growth tends to slow more in the early years than it does in later years.
A DCF is all about the idea that a dollar in the future is less valuable than a dollar today, and so the sum of these future cash flows is then discounted to today's value:
10-year free cash flow (FCF) forecast
| 2024 | 2025 | 2026 | 2027 | 2028 | 2029 | 2030 | 2031 | 2032 | 2033 | |
| Levered FCF (CN¥, Millions) | CN¥457.4m | CN¥458.7m | CN¥463.7m | CN¥471.3m | CN¥480.9m | CN¥492.0m | CN¥504.2m | CN¥517.5m | CN¥531.6m | CN¥546.4m |
| Growth Rate Estimate Source | Est @ -0.84% | Est @ 0.29% | Est @ 1.09% | Est @ 1.64% | Est @ 2.03% | Est @ 2.30% | Est @ 2.49% | Est @ 2.63% | Est @ 2.72% | Est @ 2.79% |
| Present Value (CN¥, Millions) Discounted @ 8.3% | CN¥422 | CN¥391 | CN¥365 | CN¥342 | CN¥322 | CN¥305 | CN¥288 | CN¥273 | CN¥259 | CN¥246 |
("Est" = FCF growth rate estimated by Simply Wall St)
Present Value of 10-year Cash Flow (PVCF) = CN¥3.2b
We now need to calculate the Terminal Value, which accounts for all the future cash flows after this ten year period. The Gordon Growth formula is used to calculate Terminal Value at a future annual growth rate equal to the 5-year average of the 10-year government bond yield of 2.9%. We discount the terminal cash flows to today's value at a cost of equity of 8.3%.
Terminal Value (TV)= FCF2033 × (1 + g) ÷ (r – g) = CN¥546m× (1 + 2.9%) ÷ (8.3%– 2.9%) = CN¥10b
Present Value of Terminal Value (PVTV)= TV / (1 + r)10= CN¥10b÷ ( 1 + 8.3%)10= CN¥4.7b
The total value is the sum of cash flows for the next ten years plus the discounted terminal value, which results in the Total Equity Value, which in this case is CN¥7.9b. In the final step we divide the equity value by the number of shares outstanding. Compared to the current share price of CN¥15.8, the company appears around fair value at the time of writing. Valuations are imprecise instruments though, rather like a telescope - move a few degrees and end up in a different galaxy. Do keep this in mind.
The Assumptions
Now the most important inputs to a discounted cash flow are the discount rate, and of course, the actual cash flows. If you don't agree with these result, have a go at the calculation yourself and play with the assumptions. The DCF also does not consider the possible cyclicality of an industry, or a company's future capital requirements, so it does not give a full picture of a company's potential performance. Given that we are looking at Luyang Energy-Saving Materials as potential shareholders, the cost of equity is used as the discount rate, rather than the cost of capital (or weighted average cost of capital, WACC) which accounts for debt. In this calculation we've used 8.3%, which is based on a levered beta of 0.955. Beta is a measure of a stock's volatility, compared to the market as a whole. We get our beta from the industry average beta of globally comparable companies, with an imposed limit between 0.8 and 2.0, which is a reasonable range for a stable business.
SWOT Analysis for Luyang Energy-Saving Materials
Strength
- Debt is not viewed as a risk.
- Dividend is in the top 25% of dividend payers in the market.
Weakness
- Earnings declined over the past year.
- Expensive based on P/E ratio and estimated fair value.
Opportunity
- Annual earnings are forecast to grow for the next 3 years.
Threat
- Dividends are not covered by cash flow.
- Annual earnings are forecast to grow slower than the Chinese market.
Looking Ahead:
Although the valuation of a company is important, it ideally won't be the sole piece of analysis you scrutinize for a company. It's not possible to obtain a foolproof valuation with a DCF model. Rather it should be seen as a guide to "what assumptions need to be true for this stock to be under/overvalued?" For example, changes in the company's cost of equity or the risk free rate can significantly impact the valuation. For Luyang Energy-Saving Materials, there are three additional aspects you should look at:
- Risks: Consider for instance, the ever-present spectre of investment risk. We've identified 1 warning sign with Luyang Energy-Saving Materials , and understanding this should be part of your investment process.
- Future Earnings: How does 002088's growth rate compare to its peers and the wider market? Dig deeper into the analyst consensus number for the upcoming years by interacting with our free analyst growth expectation chart.
- Other Solid Businesses: Low debt, high returns on equity and good past performance are fundamental to a strong business. Why not explore our interactive list of stocks with solid business fundamentals to see if there are other companies you may not have considered!
PS. The Simply Wall St app conducts a discounted cash flow valuation for every stock on the SZSE every day. If you want to find the calculation for other stocks just search here.
New: AI Stock Screener & Alerts
Our new AI Stock Screener scans the market every day to uncover opportunities.
• Dividend Powerhouses (3%+ Yield)
• Undervalued Small Caps with Insider Buying
• High growth Tech and AI Companies
Or build your own from over 50 metrics.
Have feedback on this article? Concerned about the content? Get in touch with us directly. Alternatively, email editorial-team (at) simplywallst.com.
This article by Simply Wall St is general in nature. We provide commentary based on historical data and analyst forecasts only using an unbiased methodology and our articles are not intended to be financial advice. It does not constitute a recommendation to buy or sell any stock, and does not take account of your objectives, or your financial situation. We aim to bring you long-term focused analysis driven by fundamental data. Note that our analysis may not factor in the latest price-sensitive company announcements or qualitative material. Simply Wall St has no position in any stocks mentioned.
About SZSE:002088
Luyang Energy-Saving Materials
Researches and develops, produces, and sells energy-saving products in the field of ceramic fiber, alumina fiber, soluble fiber, basalt fiber, and insulating firebrick in China and internationally.
Flawless balance sheet and fair value.
Market Insights

Advertisement
Community Narratives
A formidable player in AI and enterprise computing.
Fair Value US$210.00|12.2% overvalued
CO
Community Contributor
IREN's Bold Moves in Sustainable Bitcoin Mining & AI Data Centers
Fair Value US$72.52|17.1% undervalued
BL
Community Contributor
Cooling the Champions: The Aussie Tech Behind F1's Victories
Fair Value AU$12.40|38.7% undervalued
TR
Community Contributor