
Advertisement
- China
- /
- Metals and Mining
- /
- SHSE:600581
XinJiang Ba Yi Iron & Steel Co.,Ltd.'s (SHSE:600581) Shares Bounce 32% But Its Business Still Trails The Industry

XinJiang Ba Yi Iron & Steel Co.,Ltd. (SHSE:600581) shares have had a really impressive month, gaining 32% after a shaky period beforehand. Unfortunately, the gains of the last month did little to right the losses of the last year with the stock still down 19% over that time.
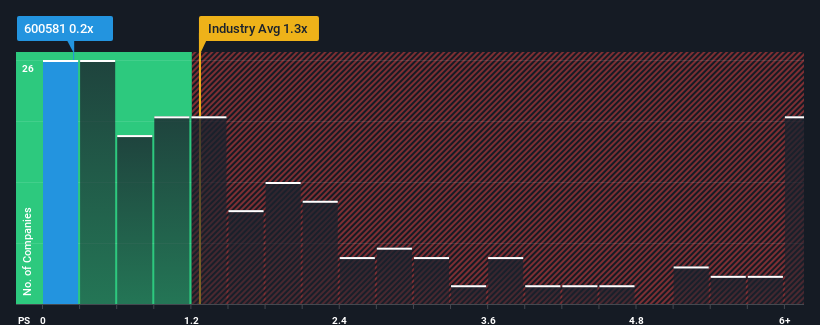
Even after such a large jump in price, it would still be understandable if you think XinJiang Ba Yi Iron & SteelLtd is a stock with good investment prospects with a price-to-sales ratios (or "P/S") of 0.2x, considering almost half the companies in China's Metals and Mining industry have P/S ratios above 1.3x. Nonetheless, we'd need to dig a little deeper to determine if there is a rational basis for the reduced P/S.
View our latest analysis for XinJiang Ba Yi Iron & SteelLtd
How XinJiang Ba Yi Iron & SteelLtd Has Been Performing
We'd have to say that with no tangible growth over the last year, XinJiang Ba Yi Iron & SteelLtd's revenue has been unimpressive. It might be that many expect the uninspiring revenue performance to worsen, which has repressed the P/S. If you like the company, you'd be hoping this isn't the case so that you could potentially pick up some stock while it's out of favour.
We don't have analyst forecasts, but you can see how recent trends are setting up the company for the future by checking out our free report on XinJiang Ba Yi Iron & SteelLtd's earnings, revenue and cash flow.What Are Revenue Growth Metrics Telling Us About The Low P/S?
There's an inherent assumption that a company should underperform the industry for P/S ratios like XinJiang Ba Yi Iron & SteelLtd's to be considered reasonable.
If we review the last year of revenue, the company posted a result that saw barely any deviation from a year ago. The lack of growth did nothing to help the company's aggregate three-year performance, which is an unsavory 25% drop in revenue. Therefore, it's fair to say the revenue growth recently has been undesirable for the company.
Weighing that medium-term revenue trajectory against the broader industry's one-year forecast for expansion of 13% shows it's an unpleasant look.
In light of this, it's understandable that XinJiang Ba Yi Iron & SteelLtd's P/S would sit below the majority of other companies. Nonetheless, there's no guarantee the P/S has reached a floor yet with revenue going in reverse. Even just maintaining these prices could be difficult to achieve as recent revenue trends are already weighing down the shares.
The Final Word
The latest share price surge wasn't enough to lift XinJiang Ba Yi Iron & SteelLtd's P/S close to the industry median. Using the price-to-sales ratio alone to determine if you should sell your stock isn't sensible, however it can be a practical guide to the company's future prospects.
Our examination of XinJiang Ba Yi Iron & SteelLtd confirms that the company's shrinking revenue over the past medium-term is a key factor in its low price-to-sales ratio, given the industry is projected to grow. At this stage investors feel the potential for an improvement in revenue isn't great enough to justify a higher P/S ratio. If recent medium-term revenue trends continue, it's hard to see the share price moving strongly in either direction in the near future under these circumstances.
Having said that, be aware XinJiang Ba Yi Iron & SteelLtd is showing 1 warning sign in our investment analysis, you should know about.
If these risks are making you reconsider your opinion on XinJiang Ba Yi Iron & SteelLtd, explore our interactive list of high quality stocks to get an idea of what else is out there.
New: AI Stock Screener & Alerts
Our new AI Stock Screener scans the market every day to uncover opportunities.
• Dividend Powerhouses (3%+ Yield)
• Undervalued Small Caps with Insider Buying
• High growth Tech and AI Companies
Or build your own from over 50 metrics.
Have feedback on this article? Concerned about the content? Get in touch with us directly. Alternatively, email editorial-team (at) simplywallst.com.
This article by Simply Wall St is general in nature. We provide commentary based on historical data and analyst forecasts only using an unbiased methodology and our articles are not intended to be financial advice. It does not constitute a recommendation to buy or sell any stock, and does not take account of your objectives, or your financial situation. We aim to bring you long-term focused analysis driven by fundamental data. Note that our analysis may not factor in the latest price-sensitive company announcements or qualitative material. Simply Wall St has no position in any stocks mentioned.
About SHSE:600581
XinJiang Ba Yi Iron & SteelLtd
Focuses on smelting, rolling, processing, and selling of steel products in China.
Slightly overvalued very low.
Market Insights

Advertisement
Community Narratives
Pole position to benefit from GENIUS Act
Fair Value US$233.04|59.7% undervalued
CH
Community Contributor
IREN will transform from bitcoin miner to leader in AI infrastructure
Fair Value US$21.48|13.5% undervalued
KA
Community Contributor
Behind the Assay: XRF Scientific’s Role in Modern Mining Economics
Fair Value AU$2.10|1.4% undervalued
RO
Community Contributor