
Advertisement
Guizhou Chitianhua Co.,Ltd. (SHSE:600227) Held Back By Insufficient Growth Even After Shares Climb 26%

Guizhou Chitianhua Co.,Ltd. (SHSE:600227) shares have continued their recent momentum with a 26% gain in the last month alone. Not all shareholders will be feeling jubilant, since the share price is still down a very disappointing 35% in the last twelve months.
In spite of the firm bounce in price, Guizhou ChitianhuaLtd may still be sending bullish signals at the moment with its price-to-sales (or "P/S") ratio of 1.3x, since almost half of all companies in the Chemicals industry in China have P/S ratios greater than 1.9x and even P/S higher than 4x are not unusual. Nonetheless, we'd need to dig a little deeper to determine if there is a rational basis for the reduced P/S.
Check out our latest analysis for Guizhou ChitianhuaLtd
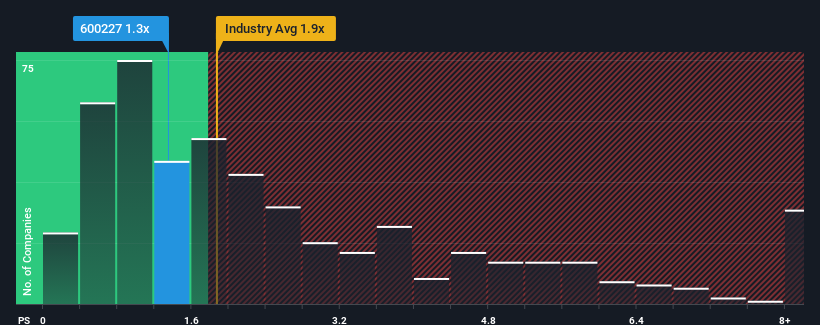
What Does Guizhou ChitianhuaLtd's P/S Mean For Shareholders?
For example, consider that Guizhou ChitianhuaLtd's financial performance has been pretty ordinary lately as revenue growth is non-existent. Perhaps the market believes the recent lacklustre revenue performance is a sign of future underperformance relative to industry peers, hurting the P/S. If not, then existing shareholders may be feeling optimistic about the future direction of the share price.
Want the full picture on earnings, revenue and cash flow for the company? Then our free report on Guizhou ChitianhuaLtd will help you shine a light on its historical performance.What Are Revenue Growth Metrics Telling Us About The Low P/S?
There's an inherent assumption that a company should underperform the industry for P/S ratios like Guizhou ChitianhuaLtd's to be considered reasonable.
Retrospectively, the last year delivered virtually the same number to the company's top line as the year before. The longer-term trend has been no better as the company has no revenue growth to show for over the last three years either. So it seems apparent to us that the company has struggled to grow revenue meaningfully over that time.
Comparing the recent medium-term revenue trends against the industry's one-year growth forecast of 23% shows it's noticeably less attractive.
With this in consideration, it's easy to understand why Guizhou ChitianhuaLtd's P/S falls short of the mark set by its industry peers. It seems most investors are expecting to see the recent limited growth rates continue into the future and are only willing to pay a reduced amount for the stock.
What We Can Learn From Guizhou ChitianhuaLtd's P/S?
Guizhou ChitianhuaLtd's stock price has surged recently, but its but its P/S still remains modest. Typically, we'd caution against reading too much into price-to-sales ratios when settling on investment decisions, though it can reveal plenty about what other market participants think about the company.
Our examination of Guizhou ChitianhuaLtd confirms that the company's revenue trends over the past three-year years are a key factor in its low price-to-sales ratio, as we suspected, given they fall short of current industry expectations. Right now shareholders are accepting the low P/S as they concede future revenue probably won't provide any pleasant surprises. Unless the recent medium-term conditions improve, they will continue to form a barrier for the share price around these levels.
Having said that, be aware Guizhou ChitianhuaLtd is showing 2 warning signs in our investment analysis, and 1 of those is a bit unpleasant.
Of course, profitable companies with a history of great earnings growth are generally safer bets. So you may wish to see this free collection of other companies that have reasonable P/E ratios and have grown earnings strongly.
New: Manage All Your Stock Portfolios in One Place
We've created the ultimate portfolio companion for stock investors, and it's free.
• Connect an unlimited number of Portfolios and see your total in one currency
• Be alerted to new Warning Signs or Risks via email or mobile
• Track the Fair Value of your stocks
Have feedback on this article? Concerned about the content? Get in touch with us directly. Alternatively, email editorial-team (at) simplywallst.com.
This article by Simply Wall St is general in nature. We provide commentary based on historical data and analyst forecasts only using an unbiased methodology and our articles are not intended to be financial advice. It does not constitute a recommendation to buy or sell any stock, and does not take account of your objectives, or your financial situation. We aim to bring you long-term focused analysis driven by fundamental data. Note that our analysis may not factor in the latest price-sensitive company announcements or qualitative material. Simply Wall St has no position in any stocks mentioned.
About SHSE:600227
Guizhou ChitianhuaLtd
Engages in the chemical and pharmaceutical businesses in China.
Fair value with acceptable track record.
Market Insights

Advertisement
Community Narratives
RIO is poised to weather a depressed iron ore environment, but commodity diversification comes with lower margins
Fair Value AU$110.51|4.0% overvalued
DU
Community Contributor
The demand for personalized medicine will keep Thermo Fisher Scientific thriving
Fair Value US$540.27|21.5% undervalued
UN
Community Contributor
Silver Play by A Family with 10x Potential
Fair Value UK£24.00|88.8% undervalued
RO
Community Contributor