- China
- /
- Healthcare Services
- /
- SZSE:300244
Dian Diagnostics GroupLtd (SZSE:300244 investor three-year losses grow to 37% as the stock sheds CN¥697m this past week


Dian Diagnostics Group Co.,Ltd. (SZSE:300244) shareholders will doubtless be very grateful to see the share price up 67% in the last month. But that doesn't change the fact that the returns over the last three years have been less than pleasing. After all, the share price is down 43% in the last three years, significantly under-performing the market.
Since Dian Diagnostics GroupLtd has shed CN¥697m from its value in the past 7 days, let's see if the longer term decline has been driven by the business' economics.
See our latest analysis for Dian Diagnostics GroupLtd
To paraphrase Benjamin Graham: Over the short term the market is a voting machine, but over the long term it's a weighing machine. One imperfect but simple way to consider how the market perception of a company has shifted is to compare the change in the earnings per share (EPS) with the share price movement.
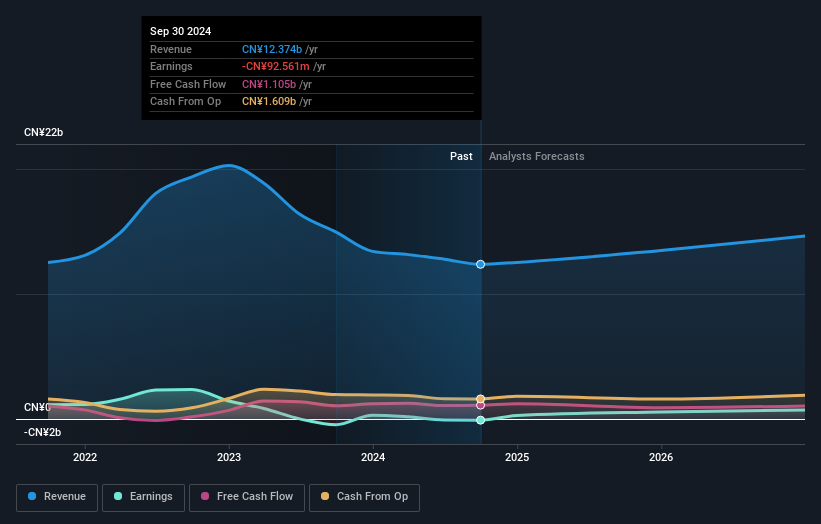
We know that Dian Diagnostics GroupLtd has been profitable in the past. However, it made a loss in the last twelve months, suggesting profit may be an unreliable metric at this stage. Other metrics may better explain the share price move.
Arguably the revenue decline of 5.1% per year has people thinking Dian Diagnostics GroupLtd is shrinking. After all, if revenue keeps shrinking, it may be difficult to find earnings growth in the future.
The image below shows how earnings and revenue have tracked over time (if you click on the image you can see greater detail).
Dian Diagnostics GroupLtd is a well known stock, with plenty of analyst coverage, suggesting some visibility into future growth. So we recommend checking out this free report showing consensus forecasts
What About Dividends?
It is important to consider the total shareholder return, as well as the share price return, for any given stock. The TSR is a return calculation that accounts for the value of cash dividends (assuming that any dividend received was reinvested) and the calculated value of any discounted capital raisings and spin-offs. So for companies that pay a generous dividend, the TSR is often a lot higher than the share price return. We note that for Dian Diagnostics GroupLtd the TSR over the last 3 years was -37%, which is better than the share price return mentioned above. The dividends paid by the company have thusly boosted the total shareholder return.
A Different Perspective
While the broader market gained around 14% in the last year, Dian Diagnostics GroupLtd shareholders lost 5.9% (even including dividends). However, keep in mind that even the best stocks will sometimes underperform the market over a twelve month period. Unfortunately, last year's performance may indicate unresolved challenges, given that it was worse than the annualised loss of 5% over the last half decade. We realise that Baron Rothschild has said investors should "buy when there is blood on the streets", but we caution that investors should first be sure they are buying a high quality business. It's always interesting to track share price performance over the longer term. But to understand Dian Diagnostics GroupLtd better, we need to consider many other factors. To that end, you should learn about the 2 warning signs we've spotted with Dian Diagnostics GroupLtd (including 1 which is potentially serious) .
For those who like to find winning investments this free list of undervalued companies with recent insider purchasing, could be just the ticket.
Please note, the market returns quoted in this article reflect the market weighted average returns of stocks that currently trade on Chinese exchanges.
New: Manage All Your Stock Portfolios in One Place
We've created the ultimate portfolio companion for stock investors, and it's free.
• Connect an unlimited number of Portfolios and see your total in one currency
• Be alerted to new Warning Signs or Risks via email or mobile
• Track the Fair Value of your stocks
Have feedback on this article? Concerned about the content? Get in touch with us directly. Alternatively, email editorial-team (at) simplywallst.com.
This article by Simply Wall St is general in nature. We provide commentary based on historical data and analyst forecasts only using an unbiased methodology and our articles are not intended to be financial advice. It does not constitute a recommendation to buy or sell any stock, and does not take account of your objectives, or your financial situation. We aim to bring you long-term focused analysis driven by fundamental data. Note that our analysis may not factor in the latest price-sensitive company announcements or qualitative material. Simply Wall St has no position in any stocks mentioned.
About SZSE:300244
Dian Diagnostics GroupLtd
Operates as a third-party independent medical diagnostic service company in China.
Undervalued with excellent balance sheet and pays a dividend.
Market Insights

Community Narratives
