
Advertisement
- China
- /
- Oil and Gas
- /
- SHSE:600403
These Return Metrics Don't Make Henan Dayou Energy (SHSE:600403) Look Too Strong
When we're researching a company, it's sometimes hard to find the warning signs, but there are some financial metrics that can help spot trouble early. Businesses in decline often have two underlying trends, firstly, a declining return on capital employed (ROCE) and a declining base of capital employed. Trends like this ultimately mean the business is reducing its investments and also earning less on what it has invested. So after glancing at the trends within Henan Dayou Energy (SHSE:600403), we weren't too hopeful.
What Is Return On Capital Employed (ROCE)?
Just to clarify if you're unsure, ROCE is a metric for evaluating how much pre-tax income (in percentage terms) a company earns on the capital invested in its business. The formula for this calculation on Henan Dayou Energy is:
Return on Capital Employed = Earnings Before Interest and Tax (EBIT) ÷ (Total Assets - Current Liabilities)
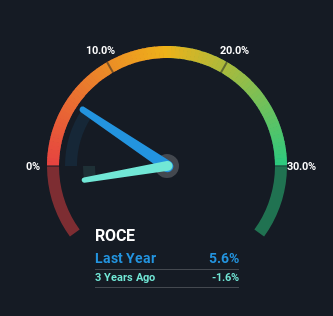
0.056 = CN¥579m ÷ (CN¥22b - CN¥11b) (Based on the trailing twelve months to September 2023).
Therefore, Henan Dayou Energy has an ROCE of 5.6%. In absolute terms, that's a low return and it also under-performs the Oil and Gas industry average of 12%.
Check out our latest analysis for Henan Dayou Energy
While the past is not representative of the future, it can be helpful to know how a company has performed historically, which is why we have this chart above. If you'd like to look at how Henan Dayou Energy has performed in the past in other metrics, you can view this free graph of Henan Dayou Energy's past earnings, revenue and cash flow.
How Are Returns Trending?
In terms of Henan Dayou Energy's historical ROCE movements, the trend doesn't inspire confidence. About five years ago, returns on capital were 14%, however they're now substantially lower than that as we saw above. And on the capital employed front, the business is utilizing roughly the same amount of capital as it was back then. Since returns are falling and the business has the same amount of assets employed, this can suggest it's a mature business that hasn't had much growth in the last five years. So because these trends aren't typically conducive to creating a multi-bagger, we wouldn't hold our breath on Henan Dayou Energy becoming one if things continue as they have.
Another thing to note, Henan Dayou Energy has a high ratio of current liabilities to total assets of 52%. This can bring about some risks because the company is basically operating with a rather large reliance on its suppliers or other sorts of short-term creditors. While it's not necessarily a bad thing, it can be beneficial if this ratio is lower.
The Bottom Line
In summary, it's unfortunate that Henan Dayou Energy is generating lower returns from the same amount of capital. Investors haven't taken kindly to these developments, since the stock has declined 21% from where it was five years ago. That being the case, unless the underlying trends revert to a more positive trajectory, we'd consider looking elsewhere.
On a final note, we found 3 warning signs for Henan Dayou Energy (1 is concerning) you should be aware of.
If you want to search for solid companies with great earnings, check out this free list of companies with good balance sheets and impressive returns on equity.
Valuation is complex, but we're here to simplify it.
Discover if Henan Dayou Energy might be undervalued or overvalued with our detailed analysis, featuring fair value estimates, potential risks, dividends, insider trades, and its financial condition.
Access Free AnalysisHave feedback on this article? Concerned about the content? Get in touch with us directly. Alternatively, email editorial-team (at) simplywallst.com.
This article by Simply Wall St is general in nature. We provide commentary based on historical data and analyst forecasts only using an unbiased methodology and our articles are not intended to be financial advice. It does not constitute a recommendation to buy or sell any stock, and does not take account of your objectives, or your financial situation. We aim to bring you long-term focused analysis driven by fundamental data. Note that our analysis may not factor in the latest price-sensitive company announcements or qualitative material. Simply Wall St has no position in any stocks mentioned.
About SHSE:600403
Adequate balance sheet very low.
Market Insights

Advertisement
Community Narratives
RIO is poised to weather a depressed iron ore environment, but commodity diversification comes with lower margins
Fair Value AU$110.51|4.0% overvalued
DU
Community Contributor
The demand for personalized medicine will keep Thermo Fisher Scientific thriving
Fair Value US$540.27|21.5% undervalued
UN
Community Contributor
Silver Play by A Family with 10x Potential
Fair Value UK£24.00|88.8% undervalued
RO
Community Contributor