- China
- /
- Food and Staples Retail
- /
- SZSE:002336
Risks Still Elevated At These Prices As Renrenle Commercial Group Co.,Ltd. (SZSE:002336) Shares Dive 40%


Unfortunately for some shareholders, the Renrenle Commercial Group Co.,Ltd. (SZSE:002336) share price has dived 40% in the last thirty days, prolonging recent pain. For any long-term shareholders, the last month ends a year to forget by locking in a 75% share price decline.
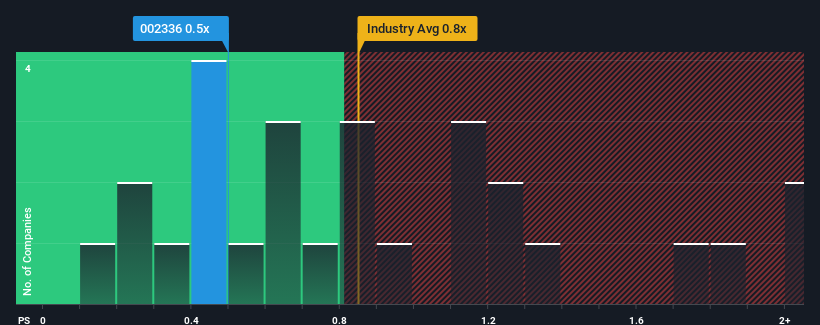
Even after such a large drop in price, there still wouldn't be many who think Renrenle Commercial GroupLtd's price-to-sales (or "P/S") ratio of 0.5x is worth a mention when the median P/S in China's Consumer Retailing industry is similar at about 0.8x. However, investors might be overlooking a clear opportunity or potential setback if there is no rational basis for the P/S.
View our latest analysis for Renrenle Commercial GroupLtd
How Renrenle Commercial GroupLtd Has Been Performing
For example, consider that Renrenle Commercial GroupLtd's financial performance has been poor lately as its revenue has been in decline. It might be that many expect the company to put the disappointing revenue performance behind them over the coming period, which has kept the P/S from falling. If not, then existing shareholders may be a little nervous about the viability of the share price.
We don't have analyst forecasts, but you can see how recent trends are setting up the company for the future by checking out our free report on Renrenle Commercial GroupLtd's earnings, revenue and cash flow.Do Revenue Forecasts Match The P/S Ratio?
In order to justify its P/S ratio, Renrenle Commercial GroupLtd would need to produce growth that's similar to the industry.
Retrospectively, the last year delivered a frustrating 33% decrease to the company's top line. This means it has also seen a slide in revenue over the longer-term as revenue is down 58% in total over the last three years. Accordingly, shareholders would have felt downbeat about the medium-term rates of revenue growth.
Comparing that to the industry, which is predicted to deliver 17% growth in the next 12 months, the company's downward momentum based on recent medium-term revenue results is a sobering picture.
With this in mind, we find it worrying that Renrenle Commercial GroupLtd's P/S exceeds that of its industry peers. It seems most investors are ignoring the recent poor growth rate and are hoping for a turnaround in the company's business prospects. Only the boldest would assume these prices are sustainable as a continuation of recent revenue trends is likely to weigh on the share price eventually.
What We Can Learn From Renrenle Commercial GroupLtd's P/S?
Renrenle Commercial GroupLtd's plummeting stock price has brought its P/S back to a similar region as the rest of the industry. We'd say the price-to-sales ratio's power isn't primarily as a valuation instrument but rather to gauge current investor sentiment and future expectations.
Our look at Renrenle Commercial GroupLtd revealed its shrinking revenues over the medium-term haven't impacted the P/S as much as we anticipated, given the industry is set to grow. Even though it matches the industry, we're uncomfortable with the current P/S ratio, as this dismal revenue performance is unlikely to support a more positive sentiment for long. Unless the recent medium-term conditions improve markedly, investors will have a hard time accepting the share price as fair value.
We don't want to rain on the parade too much, but we did also find 3 warning signs for Renrenle Commercial GroupLtd (2 don't sit too well with us!) that you need to be mindful of.
If you're unsure about the strength of Renrenle Commercial GroupLtd's business, why not explore our interactive list of stocks with solid business fundamentals for some other companies you may have missed.
If you're looking to trade Renrenle Commercial GroupLtd, open an account with the lowest-cost platform trusted by professionals, Interactive Brokers.
With clients in over 200 countries and territories, and access to 160 markets, IBKR lets you trade stocks, options, futures, forex, bonds and funds from a single integrated account.
Enjoy no hidden fees, no account minimums, and FX conversion rates as low as 0.03%, far better than what most brokers offer.
Sponsored ContentNew: AI Stock Screener & Alerts
Our new AI Stock Screener scans the market every day to uncover opportunities.
• Dividend Powerhouses (3%+ Yield)
• Undervalued Small Caps with Insider Buying
• High growth Tech and AI Companies
Or build your own from over 50 metrics.
Have feedback on this article? Concerned about the content? Get in touch with us directly. Alternatively, email editorial-team (at) simplywallst.com.
This article by Simply Wall St is general in nature. We provide commentary based on historical data and analyst forecasts only using an unbiased methodology and our articles are not intended to be financial advice. It does not constitute a recommendation to buy or sell any stock, and does not take account of your objectives, or your financial situation. We aim to bring you long-term focused analysis driven by fundamental data. Note that our analysis may not factor in the latest price-sensitive company announcements or qualitative material. Simply Wall St has no position in any stocks mentioned.
About SZSE:002336
Renrenle Commercial GroupLtd
Operates hypermarkets, boutique supermarkets, renrenle department stores, and online shopping lifestyle supermarkets in China.
Low with questionable track record.
Market Insights

Community Narratives


