These 4 Measures Indicate That Alpha Group (SZSE:002292) Is Using Debt Reasonably Well


The external fund manager backed by Berkshire Hathaway's Charlie Munger, Li Lu, makes no bones about it when he says 'The biggest investment risk is not the volatility of prices, but whether you will suffer a permanent loss of capital.' It's only natural to consider a company's balance sheet when you examine how risky it is, since debt is often involved when a business collapses. Importantly, Alpha Group (SZSE:002292) does carry debt. But the more important question is: how much risk is that debt creating?
What Risk Does Debt Bring?
Debt assists a business until the business has trouble paying it off, either with new capital or with free cash flow. If things get really bad, the lenders can take control of the business. However, a more usual (but still expensive) situation is where a company must dilute shareholders at a cheap share price simply to get debt under control. Having said that, the most common situation is where a company manages its debt reasonably well - and to its own advantage. When we think about a company's use of debt, we first look at cash and debt together.
Check out our latest analysis for Alpha Group
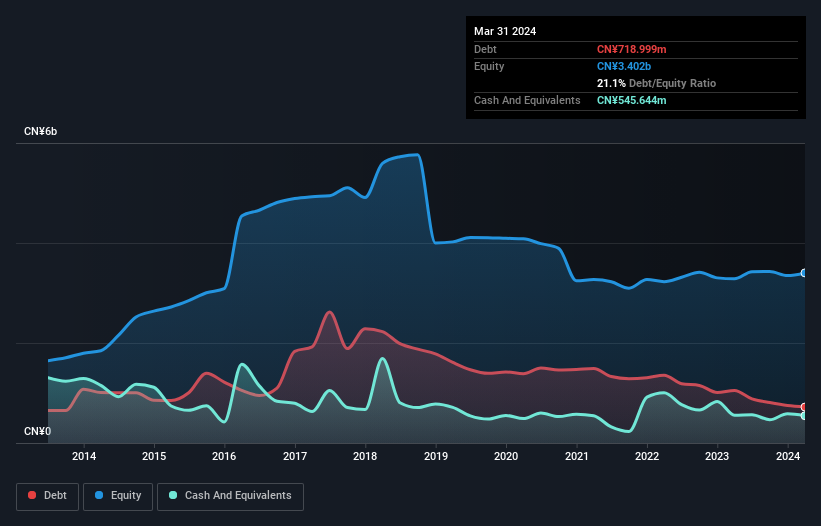
What Is Alpha Group's Net Debt?
As you can see below, Alpha Group had CN¥719.0m of debt at March 2024, down from CN¥1.05b a year prior. However, it also had CN¥545.6m in cash, and so its net debt is CN¥173.4m.
How Strong Is Alpha Group's Balance Sheet?
The latest balance sheet data shows that Alpha Group had liabilities of CN¥1.28b due within a year, and liabilities of CN¥162.1m falling due after that. On the other hand, it had cash of CN¥545.6m and CN¥436.2m worth of receivables due within a year. So its liabilities outweigh the sum of its cash and (near-term) receivables by CN¥458.9m.
Since publicly traded Alpha Group shares are worth a total of CN¥9.52b, it seems unlikely that this level of liabilities would be a major threat. Having said that, it's clear that we should continue to monitor its balance sheet, lest it change for the worse.
In order to size up a company's debt relative to its earnings, we calculate its net debt divided by its earnings before interest, tax, depreciation, and amortization (EBITDA) and its earnings before interest and tax (EBIT) divided by its interest expense (its interest cover). The advantage of this approach is that we take into account both the absolute quantum of debt (with net debt to EBITDA) and the actual interest expenses associated with that debt (with its interest cover ratio).
Looking at its net debt to EBITDA of 0.98 and interest cover of 4.9 times, it seems to us that Alpha Group is probably using debt in a pretty reasonable way. So we'd recommend keeping a close eye on the impact financing costs are having on the business. We also note that Alpha Group improved its EBIT from a last year's loss to a positive CN¥134m. The balance sheet is clearly the area to focus on when you are analysing debt. But ultimately the future profitability of the business will decide if Alpha Group can strengthen its balance sheet over time. So if you're focused on the future you can check out this free report showing analyst profit forecasts.
But our final consideration is also important, because a company cannot pay debt with paper profits; it needs cold hard cash. So it is important to check how much of its earnings before interest and tax (EBIT) converts to actual free cash flow. Over the last year, Alpha Group actually produced more free cash flow than EBIT. That sort of strong cash conversion gets us as excited as the crowd when the beat drops at a Daft Punk concert.
Our View
Alpha Group's conversion of EBIT to free cash flow suggests it can handle its debt as easily as Cristiano Ronaldo could score a goal against an under 14's goalkeeper. And that's just the beginning of the good news since its net debt to EBITDA is also very heartening. When we consider the range of factors above, it looks like Alpha Group is pretty sensible with its use of debt. While that brings some risk, it can also enhance returns for shareholders. Above most other metrics, we think its important to track how fast earnings per share is growing, if at all. If you've also come to that realization, you're in luck, because today you can view this interactive graph of Alpha Group's earnings per share history for free.
If, after all that, you're more interested in a fast growing company with a rock-solid balance sheet, then check out our list of net cash growth stocks without delay.
If you're looking to trade Alpha Group, open an account with the lowest-cost platform trusted by professionals, Interactive Brokers.
With clients in over 200 countries and territories, and access to 160 markets, IBKR lets you trade stocks, options, futures, forex, bonds and funds from a single integrated account.
Enjoy no hidden fees, no account minimums, and FX conversion rates as low as 0.03%, far better than what most brokers offer.
Sponsored ContentNew: Manage All Your Stock Portfolios in One Place
We've created the ultimate portfolio companion for stock investors, and it's free.
• Connect an unlimited number of Portfolios and see your total in one currency
• Be alerted to new Warning Signs or Risks via email or mobile
• Track the Fair Value of your stocks
Have feedback on this article? Concerned about the content? Get in touch with us directly. Alternatively, email editorial-team (at) simplywallst.com.
This article by Simply Wall St is general in nature. We provide commentary based on historical data and analyst forecasts only using an unbiased methodology and our articles are not intended to be financial advice. It does not constitute a recommendation to buy or sell any stock, and does not take account of your objectives, or your financial situation. We aim to bring you long-term focused analysis driven by fundamental data. Note that our analysis may not factor in the latest price-sensitive company announcements or qualitative material. Simply Wall St has no position in any stocks mentioned.
About SZSE:002292
Alpha Group
Operates as an animation and entertainment company in China and internationally.
Flawless balance sheet with acceptable track record.
Similar Companies
Market Insights

Community Narratives
