
Advertisement
Despite delivering investors losses of 15% over the past 1 year, Fujian Fynex Textile Science & Technology (SHSE:600493) has been growing its earnings
This week we saw the Fujian Fynex Textile Science & Technology Co., Ltd. (SHSE:600493) share price climb by 17%. But that is minimal compensation for the share price under-performance over the last year. The cold reality is that the stock has dropped 17% in one year, under-performing the market.
The recent uptick of 17% could be a positive sign of things to come, so let's take a look at historical fundamentals.
See our latest analysis for Fujian Fynex Textile Science & Technology
While markets are a powerful pricing mechanism, share prices reflect investor sentiment, not just underlying business performance. One way to examine how market sentiment has changed over time is to look at the interaction between a company's share price and its earnings per share (EPS).
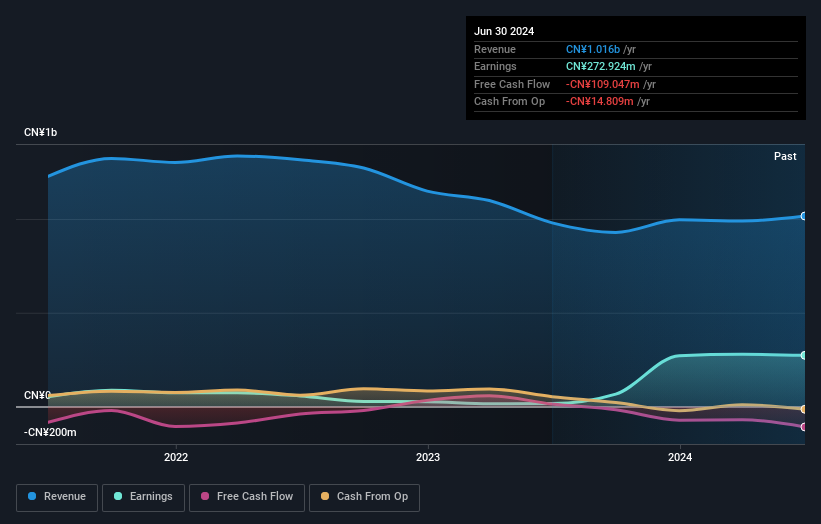
The last year saw Fujian Fynex Textile Science & Technology's EPS really take off. The rate of growth may not be sustainable, but it is still really positive. As a result, we're surprised to see the weak share price. So it's worth taking a look at some other metrics.
With a low yield of 2.0% we doubt that the dividend influences the share price much. Fujian Fynex Textile Science & Technology's revenue is actually up 3.7% over the last year. Since we can't easily explain the share price movement based on these metrics, it might be worth considering how market sentiment has changed towards the stock.
The company's revenue and earnings (over time) are depicted in the image below (click to see the exact numbers).
This free interactive report on Fujian Fynex Textile Science & Technology's balance sheet strength is a great place to start, if you want to investigate the stock further.
What About Dividends?
It is important to consider the total shareholder return, as well as the share price return, for any given stock. The TSR is a return calculation that accounts for the value of cash dividends (assuming that any dividend received was reinvested) and the calculated value of any discounted capital raisings and spin-offs. It's fair to say that the TSR gives a more complete picture for stocks that pay a dividend. As it happens, Fujian Fynex Textile Science & Technology's TSR for the last 1 year was -15%, which exceeds the share price return mentioned earlier. And there's no prize for guessing that the dividend payments largely explain the divergence!
A Different Perspective
While the broader market lost about 6.0% in the twelve months, Fujian Fynex Textile Science & Technology shareholders did even worse, losing 15% (even including dividends). Having said that, it's inevitable that some stocks will be oversold in a falling market. The key is to keep your eyes on the fundamental developments. Regrettably, last year's performance caps off a bad run, with the shareholders facing a total loss of 1.4% per year over five years. We realise that Baron Rothschild has said investors should "buy when there is blood on the streets", but we caution that investors should first be sure they are buying a high quality business. It's always interesting to track share price performance over the longer term. But to understand Fujian Fynex Textile Science & Technology better, we need to consider many other factors. Take risks, for example - Fujian Fynex Textile Science & Technology has 2 warning signs (and 1 which is significant) we think you should know about.
For those who like to find winning investments this free list of undervalued companies with recent insider purchasing, could be just the ticket.
Please note, the market returns quoted in this article reflect the market weighted average returns of stocks that currently trade on Chinese exchanges.
New: AI Stock Screener & Alerts
Our new AI Stock Screener scans the market every day to uncover opportunities.
• Dividend Powerhouses (3%+ Yield)
• Undervalued Small Caps with Insider Buying
• High growth Tech and AI Companies
Or build your own from over 50 metrics.
Have feedback on this article? Concerned about the content? Get in touch with us directly. Alternatively, email editorial-team (at) simplywallst.com.
This article by Simply Wall St is general in nature. We provide commentary based on historical data and analyst forecasts only using an unbiased methodology and our articles are not intended to be financial advice. It does not constitute a recommendation to buy or sell any stock, and does not take account of your objectives, or your financial situation. We aim to bring you long-term focused analysis driven by fundamental data. Note that our analysis may not factor in the latest price-sensitive company announcements or qualitative material. Simply Wall St has no position in any stocks mentioned.
About SHSE:600493
Fujian Fynex Textile Science & Technology
Fujian Fynex Textile Science & Technology Co., Ltd.
Solid track record with adequate balance sheet.
Market Insights


Advertisement
Community Narratives
Nike's Direct-to-Consumer Focus Will Drive Future Growth
Fair Value US$87.90|18.2% undervalued
UN
Community Contributor
Novo Nordisk will dominate GLP-1 market with Ozempic and Wegovy growth
Fair Value US$89.59|12.1% undervalued
BE
Community Contributor
Rheinmetall could get 20-25% of EU-NATO 3%-GDP defence spending
Fair Value €7.57k|82.4% undervalued
NO
Community Contributor