- China
- /
- Professional Services
- /
- SZSE:002949
Shenzhen Capol International & Associatesco.Ltd (SZSE:002949) stock performs better than its underlying earnings growth over last year


If you want to compound wealth in the stock market, you can do so by buying an index fund. But one can do better than that by picking better than average stocks (as part of a diversified portfolio). To wit, the Shenzhen Capol International & Associatesco.,Ltd (SZSE:002949) share price is 26% higher than it was a year ago, much better than the market return of around 9.4% (not including dividends) in the same period. So that should have shareholders smiling. Looking back further, the share price is 21% higher than it was three years ago.
On the back of a solid 7-day performance, let's check what role the company's fundamentals have played in driving long term shareholder returns.
View our latest analysis for Shenzhen Capol International & Associatesco.Ltd
In his essay The Superinvestors of Graham-and-Doddsville Warren Buffett described how share prices do not always rationally reflect the value of a business. One imperfect but simple way to consider how the market perception of a company has shifted is to compare the change in the earnings per share (EPS) with the share price movement.
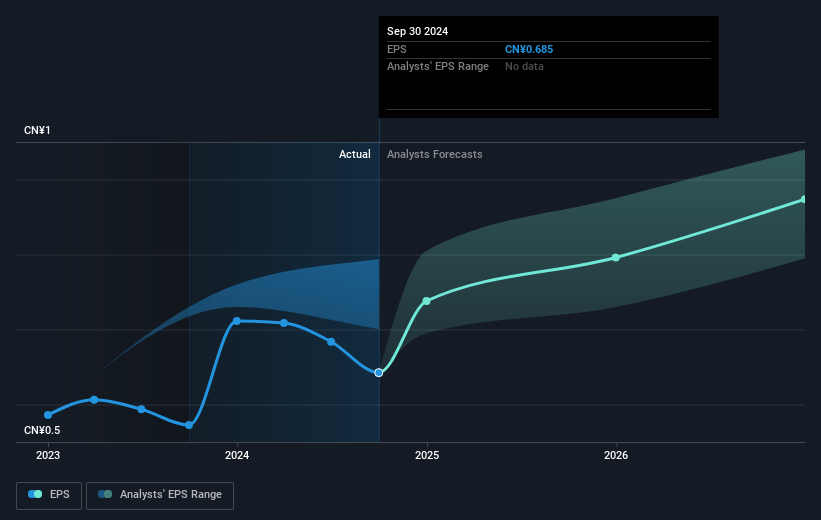
During the last year Shenzhen Capol International & Associatesco.Ltd grew its earnings per share (EPS) by 26%. This EPS growth is remarkably close to the 26% increase in the share price. This makes us think the market hasn't really changed its sentiment around the company, in the last year. It makes intuitive sense that the share price and EPS would grow at similar rates.
The company's earnings per share (over time) is depicted in the image below (click to see the exact numbers).
We know that Shenzhen Capol International & Associatesco.Ltd has improved its bottom line lately, but is it going to grow revenue? This free report showing analyst revenue forecasts should help you figure out if the EPS growth can be sustained.
What About Dividends?
It is important to consider the total shareholder return, as well as the share price return, for any given stock. The TSR incorporates the value of any spin-offs or discounted capital raisings, along with any dividends, based on the assumption that the dividends are reinvested. It's fair to say that the TSR gives a more complete picture for stocks that pay a dividend. In the case of Shenzhen Capol International & Associatesco.Ltd, it has a TSR of 35% for the last 1 year. That exceeds its share price return that we previously mentioned. And there's no prize for guessing that the dividend payments largely explain the divergence!
A Different Perspective
We're pleased to report that Shenzhen Capol International & Associatesco.Ltd shareholders have received a total shareholder return of 35% over one year. And that does include the dividend. That certainly beats the loss of about 1.8% per year over the last half decade. We generally put more weight on the long term performance over the short term, but the recent improvement could hint at a (positive) inflection point within the business. I find it very interesting to look at share price over the long term as a proxy for business performance. But to truly gain insight, we need to consider other information, too. Even so, be aware that Shenzhen Capol International & Associatesco.Ltd is showing 1 warning sign in our investment analysis , you should know about...
For those who like to find winning investments this free list of undervalued companies with recent insider purchasing, could be just the ticket.
Please note, the market returns quoted in this article reflect the market weighted average returns of stocks that currently trade on Chinese exchanges.
If you're looking to trade Shenzhen Capol International & Associatesco.Ltd, open an account with the lowest-cost platform trusted by professionals, Interactive Brokers.
With clients in over 200 countries and territories, and access to 160 markets, IBKR lets you trade stocks, options, futures, forex, bonds and funds from a single integrated account.
Enjoy no hidden fees, no account minimums, and FX conversion rates as low as 0.03%, far better than what most brokers offer.
Sponsored ContentNew: Manage All Your Stock Portfolios in One Place
We've created the ultimate portfolio companion for stock investors, and it's free.
• Connect an unlimited number of Portfolios and see your total in one currency
• Be alerted to new Warning Signs or Risks via email or mobile
• Track the Fair Value of your stocks
Have feedback on this article? Concerned about the content? Get in touch with us directly. Alternatively, email editorial-team (at) simplywallst.com.
This article by Simply Wall St is general in nature. We provide commentary based on historical data and analyst forecasts only using an unbiased methodology and our articles are not intended to be financial advice. It does not constitute a recommendation to buy or sell any stock, and does not take account of your objectives, or your financial situation. We aim to bring you long-term focused analysis driven by fundamental data. Note that our analysis may not factor in the latest price-sensitive company announcements or qualitative material. Simply Wall St has no position in any stocks mentioned.
About SZSE:002949
Shenzhen Capol International & Associatesco.Ltd
Provides architectural design services.
Excellent balance sheet with proven track record.
