- China
- /
- Professional Services
- /
- SHSE:688509
Zhengyuan Geomatics Group Co.,Ltd.'s (SHSE:688509) Shares Climb 27% But Its Business Is Yet to Catch Up

Those holding Zhengyuan Geomatics Group Co.,Ltd. (SHSE:688509) shares would be relieved that the share price has rebounded 27% in the last thirty days, but it needs to keep going to repair the recent damage it has caused to investor portfolios. Not all shareholders will be feeling jubilant, since the share price is still down a very disappointing 28% in the last twelve months.
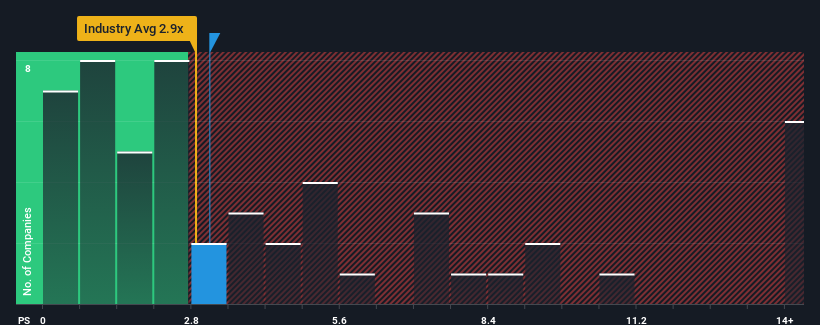
Even after such a large jump in price, you could still be forgiven for feeling indifferent about Zhengyuan Geomatics GroupLtd's P/S ratio of 3.1x, since the median price-to-sales (or "P/S") ratio for the Professional Services industry in China is also close to 2.9x. While this might not raise any eyebrows, if the P/S ratio is not justified investors could be missing out on a potential opportunity or ignoring looming disappointment.
View our latest analysis for Zhengyuan Geomatics GroupLtd
What Does Zhengyuan Geomatics GroupLtd's P/S Mean For Shareholders?
For instance, Zhengyuan Geomatics GroupLtd's receding revenue in recent times would have to be some food for thought. Perhaps investors believe the recent revenue performance is enough to keep in line with the industry, which is keeping the P/S from dropping off. If not, then existing shareholders may be a little nervous about the viability of the share price.
Although there are no analyst estimates available for Zhengyuan Geomatics GroupLtd, take a look at this free data-rich visualisation to see how the company stacks up on earnings, revenue and cash flow.Is There Some Revenue Growth Forecasted For Zhengyuan Geomatics GroupLtd?
The only time you'd be comfortable seeing a P/S like Zhengyuan Geomatics GroupLtd's is when the company's growth is tracking the industry closely.
Retrospectively, the last year delivered a frustrating 32% decrease to the company's top line. As a result, revenue from three years ago have also fallen 47% overall. Accordingly, shareholders would have felt downbeat about the medium-term rates of revenue growth.
In contrast to the company, the rest of the industry is expected to grow by 91% over the next year, which really puts the company's recent medium-term revenue decline into perspective.
With this information, we find it concerning that Zhengyuan Geomatics GroupLtd is trading at a fairly similar P/S compared to the industry. Apparently many investors in the company are way less bearish than recent times would indicate and aren't willing to let go of their stock right now. There's a good chance existing shareholders are setting themselves up for future disappointment if the P/S falls to levels more in line with the recent negative growth rates.
The Final Word
Zhengyuan Geomatics GroupLtd appears to be back in favour with a solid price jump bringing its P/S back in line with other companies in the industry We'd say the price-to-sales ratio's power isn't primarily as a valuation instrument but rather to gauge current investor sentiment and future expectations.
The fact that Zhengyuan Geomatics GroupLtd currently trades at a P/S on par with the rest of the industry is surprising to us since its recent revenues have been in decline over the medium-term, all while the industry is set to grow. Even though it matches the industry, we're uncomfortable with the current P/S ratio, as this dismal revenue performance is unlikely to support a more positive sentiment for long. If recent medium-term revenue trends continue, it will place shareholders' investments at risk and potential investors in danger of paying an unnecessary premium.
It is also worth noting that we have found 1 warning sign for Zhengyuan Geomatics GroupLtd that you need to take into consideration.
If companies with solid past earnings growth is up your alley, you may wish to see this free collection of other companies with strong earnings growth and low P/E ratios.
The New Payments ETF Is Live on NASDAQ:
Money is moving to real-time rails, and a newly listed ETF now gives investors direct exposure. Fast settlement. Institutional custody. Simple access.
Explore how this launch could reshape portfolios
Sponsored ContentValuation is complex, but we're here to simplify it.
Discover if Zhengyuan Geomatics GroupLtd might be undervalued or overvalued with our detailed analysis, featuring fair value estimates, potential risks, dividends, insider trades, and its financial condition.
Access Free AnalysisHave feedback on this article? Concerned about the content? Get in touch with us directly. Alternatively, email editorial-team (at) simplywallst.com.
This article by Simply Wall St is general in nature. We provide commentary based on historical data and analyst forecasts only using an unbiased methodology and our articles are not intended to be financial advice. It does not constitute a recommendation to buy or sell any stock, and does not take account of your objectives, or your financial situation. We aim to bring you long-term focused analysis driven by fundamental data. Note that our analysis may not factor in the latest price-sensitive company announcements or qualitative material. Simply Wall St has no position in any stocks mentioned.
About SHSE:688509
Zhengyuan Geomatics GroupLtd
Engages in the research, development, and application of surveying and mapping geographical information technology services in China.
Imperfect balance sheet with very low risk.
Market Insights

Weekly Picks

THE KINGDOM OF BROWN GOODS: WHY MGPI IS BEING CRUSHED BY INVENTORY & PRIMED FOR RESURRECTION


Why Vertical Aerospace (NYSE: EVTL) is Worth Possibly Over 13x its Current Price


The Quiet Giant That Became AI’s Power Grid
Recently Updated Narratives

Butler National (Buks) outperforms.


A tech powerhouse quietly powering the world’s AI infrastructure.


Keppel DC REIT (SGX: AJBU) is a resilient gem in the data center space.
Popular Narratives

MicroVision will explode future revenue by 380.37% with a vision towards success


Crazy Undervalued 42 Baggers Silver Play (Active & Running Mine)


