
Advertisement
- China
- /
- Electrical
- /
- SZSE:300600
Some Changshu Guorui Technology Co.,Ltd. (SZSE:300600) Shareholders Look For Exit As Shares Take 28% Pounding
Changshu Guorui Technology Co.,Ltd. (SZSE:300600) shareholders that were waiting for something to happen have been dealt a blow with a 28% share price drop in the last month. Instead of being rewarded, shareholders who have already held through the last twelve months are now sitting on a 47% share price drop.
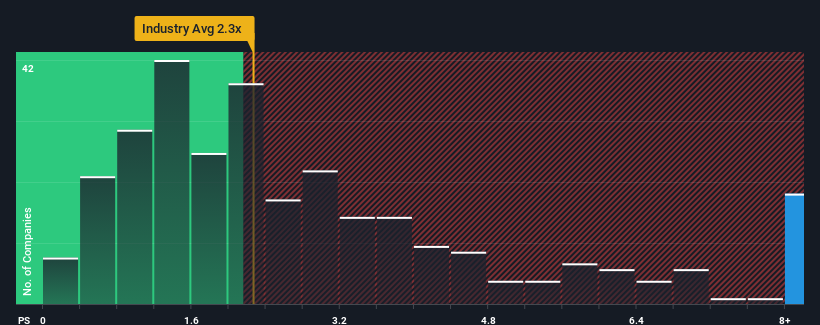
In spite of the heavy fall in price, you could still be forgiven for thinking Changshu Guorui TechnologyLtd is a stock to steer clear of with a price-to-sales ratios (or "P/S") of 8.2x, considering almost half the companies in China's Electrical industry have P/S ratios below 2.3x. However, the P/S might be quite high for a reason and it requires further investigation to determine if it's justified.
See our latest analysis for Changshu Guorui TechnologyLtd
How Has Changshu Guorui TechnologyLtd Performed Recently?
For example, consider that Changshu Guorui TechnologyLtd's financial performance has been poor lately as its revenue has been in decline. Perhaps the market believes the company can do enough to outperform the rest of the industry in the near future, which is keeping the P/S ratio high. However, if this isn't the case, investors might get caught out paying too much for the stock.
We don't have analyst forecasts, but you can see how recent trends are setting up the company for the future by checking out our free report on Changshu Guorui TechnologyLtd's earnings, revenue and cash flow.How Is Changshu Guorui TechnologyLtd's Revenue Growth Trending?
In order to justify its P/S ratio, Changshu Guorui TechnologyLtd would need to produce outstanding growth that's well in excess of the industry.
In reviewing the last year of financials, we were disheartened to see the company's revenues fell to the tune of 24%. This means it has also seen a slide in revenue over the longer-term as revenue is down 63% in total over the last three years. Accordingly, shareholders would have felt downbeat about the medium-term rates of revenue growth.
Weighing that medium-term revenue trajectory against the broader industry's one-year forecast for expansion of 24% shows it's an unpleasant look.
With this in mind, we find it worrying that Changshu Guorui TechnologyLtd's P/S exceeds that of its industry peers. It seems most investors are ignoring the recent poor growth rate and are hoping for a turnaround in the company's business prospects. Only the boldest would assume these prices are sustainable as a continuation of recent revenue trends is likely to weigh heavily on the share price eventually.
What Does Changshu Guorui TechnologyLtd's P/S Mean For Investors?
Changshu Guorui TechnologyLtd's shares may have suffered, but its P/S remains high. Using the price-to-sales ratio alone to determine if you should sell your stock isn't sensible, however it can be a practical guide to the company's future prospects.
Our examination of Changshu Guorui TechnologyLtd revealed its shrinking revenue over the medium-term isn't resulting in a P/S as low as we expected, given the industry is set to grow. When we see revenue heading backwards and underperforming the industry forecasts, we feel the possibility of the share price declining is very real, bringing the P/S back into the realm of reasonability. Unless the the circumstances surrounding the recent medium-term improve, it wouldn't be wrong to expect a a difficult period ahead for the company's shareholders.
Before you settle on your opinion, we've discovered 2 warning signs for Changshu Guorui TechnologyLtd (1 is a bit unpleasant!) that you should be aware of.
If these risks are making you reconsider your opinion on Changshu Guorui TechnologyLtd, explore our interactive list of high quality stocks to get an idea of what else is out there.
New: AI Stock Screener & Alerts
Our new AI Stock Screener scans the market every day to uncover opportunities.
• Dividend Powerhouses (3%+ Yield)
• Undervalued Small Caps with Insider Buying
• High growth Tech and AI Companies
Or build your own from over 50 metrics.
Have feedback on this article? Concerned about the content? Get in touch with us directly. Alternatively, email editorial-team (at) simplywallst.com.
This article by Simply Wall St is general in nature. We provide commentary based on historical data and analyst forecasts only using an unbiased methodology and our articles are not intended to be financial advice. It does not constitute a recommendation to buy or sell any stock, and does not take account of your objectives, or your financial situation. We aim to bring you long-term focused analysis driven by fundamental data. Note that our analysis may not factor in the latest price-sensitive company announcements or qualitative material. Simply Wall St has no position in any stocks mentioned.
About SZSE:300600
Changshu Guorui TechnologyLtd
Researches, develops, produces, and sells marine and marine engineering electrical and automation systems.
Adequate balance sheet with minimal risk.
Market Insights

Advertisement
Community Narratives
A formidable player in AI and enterprise computing.
Fair Value US$210.00|2.3% overvalued
CO
Community Contributor
IREN's Bold Moves in Sustainable Bitcoin Mining & AI Data Centers
Fair Value US$72.52|17.6% undervalued
BL
Community Contributor
Cooling the Champions: The Aussie Tech Behind F1's Victories
Fair Value AU$12.40|42.0% undervalued
TR
Community Contributor