- China
- /
- Electrical
- /
- SZSE:300062
Earnings Not Telling The Story For Ceepower Co., Ltd. (SZSE:300062) After Shares Rise 27%


Those holding Ceepower Co., Ltd. (SZSE:300062) shares would be relieved that the share price has rebounded 27% in the last thirty days, but it needs to keep going to repair the recent damage it has caused to investor portfolios. Unfortunately, the gains of the last month did little to right the losses of the last year with the stock still down 27% over that time.
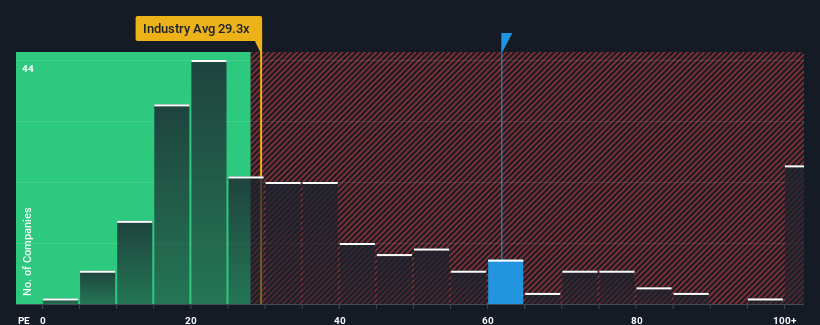
Following the firm bounce in price, Ceepower's price-to-earnings (or "P/E") ratio of 61.8x might make it look like a strong sell right now compared to the market in China, where around half of the companies have P/E ratios below 29x and even P/E's below 18x are quite common. Although, it's not wise to just take the P/E at face value as there may be an explanation why it's so lofty.
Earnings have risen at a steady rate over the last year for Ceepower, which is generally not a bad outcome. It might be that many expect the reasonable earnings performance to beat most other companies over the coming period, which has increased investors’ willingness to pay up for the stock. If not, then existing shareholders may be a little nervous about the viability of the share price.
See our latest analysis for Ceepower
Is There Enough Growth For Ceepower?
The only time you'd be truly comfortable seeing a P/E as steep as Ceepower's is when the company's growth is on track to outshine the market decidedly.
Retrospectively, the last year delivered a decent 7.1% gain to the company's bottom line. However, due to its less than impressive performance prior to this period, EPS growth is practically non-existent over the last three years overall. So it appears to us that the company has had a mixed result in terms of growing earnings over that time.
Comparing that to the market, which is predicted to deliver 41% growth in the next 12 months, the company's momentum is weaker based on recent medium-term annualised earnings results.
In light of this, it's alarming that Ceepower's P/E sits above the majority of other companies. Apparently many investors in the company are way more bullish than recent times would indicate and aren't willing to let go of their stock at any price. There's a good chance existing shareholders are setting themselves up for future disappointment if the P/E falls to levels more in line with recent growth rates.
The Bottom Line On Ceepower's P/E
Shares in Ceepower have built up some good momentum lately, which has really inflated its P/E. While the price-to-earnings ratio shouldn't be the defining factor in whether you buy a stock or not, it's quite a capable barometer of earnings expectations.
Our examination of Ceepower revealed its three-year earnings trends aren't impacting its high P/E anywhere near as much as we would have predicted, given they look worse than current market expectations. When we see weak earnings with slower than market growth, we suspect the share price is at risk of declining, sending the high P/E lower. If recent medium-term earnings trends continue, it will place shareholders' investments at significant risk and potential investors in danger of paying an excessive premium.
And what about other risks? Every company has them, and we've spotted 1 warning sign for Ceepower you should know about.
Of course, you might also be able to find a better stock than Ceepower. So you may wish to see this free collection of other companies that have reasonable P/E ratios and have grown earnings strongly.
If you're looking to trade Ceepower, open an account with the lowest-cost platform trusted by professionals, Interactive Brokers.
With clients in over 200 countries and territories, and access to 160 markets, IBKR lets you trade stocks, options, futures, forex, bonds and funds from a single integrated account.
Enjoy no hidden fees, no account minimums, and FX conversion rates as low as 0.03%, far better than what most brokers offer.
Sponsored ContentNew: AI Stock Screener & Alerts
Our new AI Stock Screener scans the market every day to uncover opportunities.
• Dividend Powerhouses (3%+ Yield)
• Undervalued Small Caps with Insider Buying
• High growth Tech and AI Companies
Or build your own from over 50 metrics.
Have feedback on this article? Concerned about the content? Get in touch with us directly. Alternatively, email editorial-team (at) simplywallst.com.
This article by Simply Wall St is general in nature. We provide commentary based on historical data and analyst forecasts only using an unbiased methodology and our articles are not intended to be financial advice. It does not constitute a recommendation to buy or sell any stock, and does not take account of your objectives, or your financial situation. We aim to bring you long-term focused analysis driven by fundamental data. Note that our analysis may not factor in the latest price-sensitive company announcements or qualitative material. Simply Wall St has no position in any stocks mentioned.
About SZSE:300062
Ceepower
Engages in the research and development, production, and sale of intelligent power transmission and distribution equipment in China and internationally.
Adequate balance sheet and overvalued.
Market Insights

Community Narratives


