- China
- /
- Construction
- /
- SZSE:002457
Here's What's Concerning About Ningxia Qinglong Pipes Industry Group's (SZSE:002457) Returns On Capital


If you're looking for a multi-bagger, there's a few things to keep an eye out for. In a perfect world, we'd like to see a company investing more capital into its business and ideally the returns earned from that capital are also increasing. Put simply, these types of businesses are compounding machines, meaning they are continually reinvesting their earnings at ever-higher rates of return. However, after briefly looking over the numbers, we don't think Ningxia Qinglong Pipes Industry Group (SZSE:002457) has the makings of a multi-bagger going forward, but let's have a look at why that may be.
Understanding Return On Capital Employed (ROCE)
For those who don't know, ROCE is a measure of a company's yearly pre-tax profit (its return), relative to the capital employed in the business. The formula for this calculation on Ningxia Qinglong Pipes Industry Group is:
Return on Capital Employed = Earnings Before Interest and Tax (EBIT) ÷ (Total Assets - Current Liabilities)
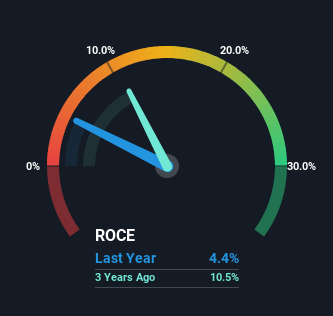
0.044 = CN¥114m ÷ (CN¥4.4b - CN¥1.8b) (Based on the trailing twelve months to June 2024).
Thus, Ningxia Qinglong Pipes Industry Group has an ROCE of 4.4%. Ultimately, that's a low return and it under-performs the Construction industry average of 5.7%.
See our latest analysis for Ningxia Qinglong Pipes Industry Group
While the past is not representative of the future, it can be helpful to know how a company has performed historically, which is why we have this chart above. If you're interested in investigating Ningxia Qinglong Pipes Industry Group's past further, check out this free graph covering Ningxia Qinglong Pipes Industry Group's past earnings, revenue and cash flow.
What Does the ROCE Trend For Ningxia Qinglong Pipes Industry Group Tell Us?
On the surface, the trend of ROCE at Ningxia Qinglong Pipes Industry Group doesn't inspire confidence. To be more specific, ROCE has fallen from 6.1% over the last five years. Meanwhile, the business is utilizing more capital but this hasn't moved the needle much in terms of sales in the past 12 months, so this could reflect longer term investments. It's worth keeping an eye on the company's earnings from here on to see if these investments do end up contributing to the bottom line.
Another thing to note, Ningxia Qinglong Pipes Industry Group has a high ratio of current liabilities to total assets of 41%. This can bring about some risks because the company is basically operating with a rather large reliance on its suppliers or other sorts of short-term creditors. Ideally we'd like to see this reduce as that would mean fewer obligations bearing risks.
What We Can Learn From Ningxia Qinglong Pipes Industry Group's ROCE
Bringing it all together, while we're somewhat encouraged by Ningxia Qinglong Pipes Industry Group's reinvestment in its own business, we're aware that returns are shrinking. Unsurprisingly, the stock has only gained 34% over the last five years, which potentially indicates that investors are accounting for this going forward. As a result, if you're hunting for a multi-bagger, we think you'd have more luck elsewhere.
If you want to know some of the risks facing Ningxia Qinglong Pipes Industry Group we've found 4 warning signs (1 can't be ignored!) that you should be aware of before investing here.
For those who like to invest in solid companies, check out this free list of companies with solid balance sheets and high returns on equity.
Valuation is complex, but we're here to simplify it.
Discover if Ningxia Qinglong Pipes Industry Group might be undervalued or overvalued with our detailed analysis, featuring fair value estimates, potential risks, dividends, insider trades, and its financial condition.
Access Free AnalysisHave feedback on this article? Concerned about the content? Get in touch with us directly. Alternatively, email editorial-team (at) simplywallst.com.
This article by Simply Wall St is general in nature. We provide commentary based on historical data and analyst forecasts only using an unbiased methodology and our articles are not intended to be financial advice. It does not constitute a recommendation to buy or sell any stock, and does not take account of your objectives, or your financial situation. We aim to bring you long-term focused analysis driven by fundamental data. Note that our analysis may not factor in the latest price-sensitive company announcements or qualitative material. Simply Wall St has no position in any stocks mentioned.
About SZSE:002457
Ningxia Qinglong Pipes Industry Group
Engages in the research and development, production, and sale of water pipelines and related products in China.
Excellent balance sheet with proven track record and pays a dividend.
