- China
- /
- Electrical
- /
- SHSE:688408
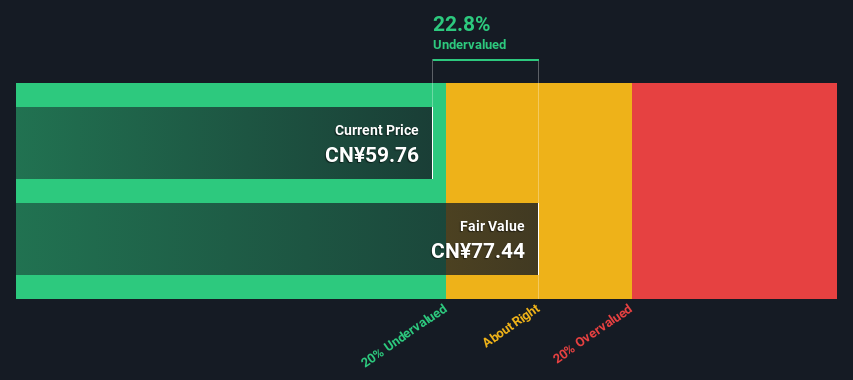
Are Investors Undervaluing Arctech Solar Holding Co., Ltd. (SHSE:688408) By 23%?


Key Insights
- Using the 2 Stage Free Cash Flow to Equity, Arctech Solar Holding fair value estimate is CN¥77.44
- Arctech Solar Holding is estimated to be 23% undervalued based on current share price of CN¥59.76
- Analyst price target for 688408 is CN¥91.13, which is 18% above our fair value estimate
Today we will run through one way of estimating the intrinsic value of Arctech Solar Holding Co., Ltd. (SHSE:688408) by estimating the company's future cash flows and discounting them to their present value. This will be done using the Discounted Cash Flow (DCF) model. It may sound complicated, but actually it is quite simple!
We generally believe that a company's value is the present value of all of the cash it will generate in the future. However, a DCF is just one valuation metric among many, and it is not without flaws. If you want to learn more about discounted cash flow, the rationale behind this calculation can be read in detail in the Simply Wall St analysis model.
Check out our latest analysis for Arctech Solar Holding
Is Arctech Solar Holding Fairly Valued?
We are going to use a two-stage DCF model, which, as the name states, takes into account two stages of growth. The first stage is generally a higher growth period which levels off heading towards the terminal value, captured in the second 'steady growth' period. In the first stage we need to estimate the cash flows to the business over the next ten years. Where possible we use analyst estimates, but when these aren't available we extrapolate the previous free cash flow (FCF) from the last estimate or reported value. We assume companies with shrinking free cash flow will slow their rate of shrinkage, and that companies with growing free cash flow will see their growth rate slow, over this period. We do this to reflect that growth tends to slow more in the early years than it does in later years.
A DCF is all about the idea that a dollar in the future is less valuable than a dollar today, and so the sum of these future cash flows is then discounted to today's value:
10-year free cash flow (FCF) estimate
| 2025 | 2026 | 2027 | 2028 | 2029 | 2030 | 2031 | 2032 | 2033 | 2034 | |
| Levered FCF (CN¥, Millions) | CN¥470.0m | CN¥636.0m | CN¥764.4m | CN¥878.8m | CN¥978.2m | CN¥1.06b | CN¥1.14b | CN¥1.20b | CN¥1.26b | CN¥1.31b |
| Growth Rate Estimate Source | Analyst x1 | Analyst x1 | Est @ 20.18% | Est @ 14.97% | Est @ 11.32% | Est @ 8.76% | Est @ 6.97% | Est @ 5.72% | Est @ 4.85% | Est @ 4.23% |
| Present Value (CN¥, Millions) Discounted @ 8.8% | CN¥432 | CN¥537 | CN¥593 | CN¥627 | CN¥641 | CN¥641 | CN¥630 | CN¥612 | CN¥590 | CN¥565 |
("Est" = FCF growth rate estimated by Simply Wall St)
Present Value of 10-year Cash Flow (PVCF) = CN¥5.9b
The second stage is also known as Terminal Value, this is the business's cash flow after the first stage. For a number of reasons a very conservative growth rate is used that cannot exceed that of a country's GDP growth. In this case we have used the 5-year average of the 10-year government bond yield (2.8%) to estimate future growth. In the same way as with the 10-year 'growth' period, we discount future cash flows to today's value, using a cost of equity of 8.8%.
Terminal Value (TV)= FCF2034 × (1 + g) ÷ (r – g) = CN¥1.3b× (1 + 2.8%) ÷ (8.8%– 2.8%) = CN¥22b
Present Value of Terminal Value (PVTV)= TV / (1 + r)10= CN¥22b÷ ( 1 + 8.8%)10= CN¥9.7b
The total value, or equity value, is then the sum of the present value of the future cash flows, which in this case is CN¥16b. In the final step we divide the equity value by the number of shares outstanding. Compared to the current share price of CN¥59.8, the company appears a touch undervalued at a 23% discount to where the stock price trades currently. Valuations are imprecise instruments though, rather like a telescope - move a few degrees and end up in a different galaxy. Do keep this in mind.
Important Assumptions
Now the most important inputs to a discounted cash flow are the discount rate, and of course, the actual cash flows. If you don't agree with these result, have a go at the calculation yourself and play with the assumptions. The DCF also does not consider the possible cyclicality of an industry, or a company's future capital requirements, so it does not give a full picture of a company's potential performance. Given that we are looking at Arctech Solar Holding as potential shareholders, the cost of equity is used as the discount rate, rather than the cost of capital (or weighted average cost of capital, WACC) which accounts for debt. In this calculation we've used 8.8%, which is based on a levered beta of 1.207. Beta is a measure of a stock's volatility, compared to the market as a whole. We get our beta from the industry average beta of globally comparable companies, with an imposed limit between 0.8 and 2.0, which is a reasonable range for a stable business.
SWOT Analysis for Arctech Solar Holding
- Earnings growth over the past year exceeded the industry.
- Debt is well covered by earnings.
- Dividend is low compared to the top 25% of dividend payers in the Electrical market.
- Annual earnings are forecast to grow faster than the Chinese market.
- Good value based on P/E ratio and estimated fair value.
- Debt is not well covered by operating cash flow.
- Paying a dividend but company has no free cash flows.
- Revenue is forecast to grow slower than 20% per year.
Moving On:
Valuation is only one side of the coin in terms of building your investment thesis, and it shouldn't be the only metric you look at when researching a company. DCF models are not the be-all and end-all of investment valuation. Preferably you'd apply different cases and assumptions and see how they would impact the company's valuation. For example, changes in the company's cost of equity or the risk free rate can significantly impact the valuation. What is the reason for the share price sitting below the intrinsic value? For Arctech Solar Holding, we've compiled three essential elements you should consider:
- Risks: Case in point, we've spotted 2 warning signs for Arctech Solar Holding you should be aware of, and 1 of them is significant.
- Future Earnings: How does 688408's growth rate compare to its peers and the wider market? Dig deeper into the analyst consensus number for the upcoming years by interacting with our free analyst growth expectation chart.
- Other High Quality Alternatives: Do you like a good all-rounder? Explore our interactive list of high quality stocks to get an idea of what else is out there you may be missing!
PS. Simply Wall St updates its DCF calculation for every Chinese stock every day, so if you want to find the intrinsic value of any other stock just search here.
New: Manage All Your Stock Portfolios in One Place
We've created the ultimate portfolio companion for stock investors, and it's free.
• Connect an unlimited number of Portfolios and see your total in one currency
• Be alerted to new Warning Signs or Risks via email or mobile
• Track the Fair Value of your stocks
Have feedback on this article? Concerned about the content? Get in touch with us directly. Alternatively, email editorial-team (at) simplywallst.com.
This article by Simply Wall St is general in nature. We provide commentary based on historical data and analyst forecasts only using an unbiased methodology and our articles are not intended to be financial advice. It does not constitute a recommendation to buy or sell any stock, and does not take account of your objectives, or your financial situation. We aim to bring you long-term focused analysis driven by fundamental data. Note that our analysis may not factor in the latest price-sensitive company announcements or qualitative material. Simply Wall St has no position in any stocks mentioned.
About SHSE:688408
Arctech Solar Holding
Manufactures and supplies solar trackers, fixed-tilt structures, and building-integrated photovoltaics (BIPV) solutions for utility-scale and commercial solar projects worldwide.
Very undervalued with high growth potential.
Similar Companies
Market Insights

Community Narratives

