
Advertisement
Nancal Technology Co.,Ltd (SHSE:603859) Stock's 25% Dive Might Signal An Opportunity But It Requires Some Scrutiny

Nancal Technology Co.,Ltd (SHSE:603859) shareholders that were waiting for something to happen have been dealt a blow with a 25% share price drop in the last month. Instead of being rewarded, shareholders who have already held through the last twelve months are now sitting on a 47% share price drop.
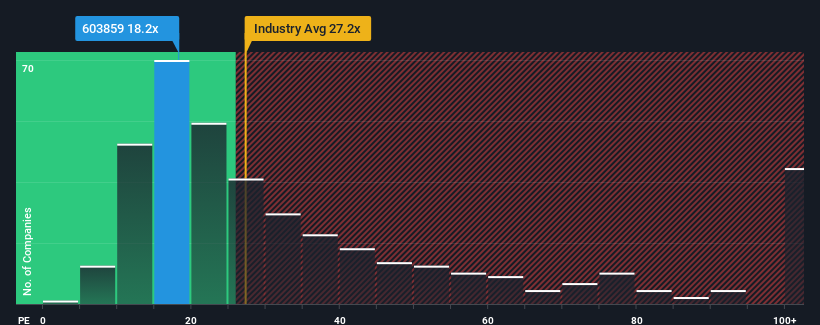
Even after such a large drop in price, given about half the companies in China have price-to-earnings ratios (or "P/E's") above 29x, you may still consider Nancal TechnologyLtd as an attractive investment with its 18.2x P/E ratio. Although, it's not wise to just take the P/E at face value as there may be an explanation why it's limited.
Nancal TechnologyLtd certainly has been doing a good job lately as it's been growing earnings more than most other companies. One possibility is that the P/E is low because investors think this strong earnings performance might be less impressive moving forward. If you like the company, you'd be hoping this isn't the case so that you could potentially pick up some stock while it's out of favour.
See our latest analysis for Nancal TechnologyLtd
How Is Nancal TechnologyLtd's Growth Trending?
The only time you'd be truly comfortable seeing a P/E as low as Nancal TechnologyLtd's is when the company's growth is on track to lag the market.
Retrospectively, the last year delivered a decent 11% gain to the company's bottom line. This was backed up an excellent period prior to see EPS up by 54% in total over the last three years. Therefore, it's fair to say the earnings growth recently has been superb for the company.
Turning to the outlook, the next three years should generate growth of 28% each year as estimated by the four analysts watching the company. Meanwhile, the rest of the market is forecast to only expand by 24% per year, which is noticeably less attractive.
With this information, we find it odd that Nancal TechnologyLtd is trading at a P/E lower than the market. Apparently some shareholders are doubtful of the forecasts and have been accepting significantly lower selling prices.
The Final Word
Nancal TechnologyLtd's recently weak share price has pulled its P/E below most other companies. Generally, our preference is to limit the use of the price-to-earnings ratio to establishing what the market thinks about the overall health of a company.
We've established that Nancal TechnologyLtd currently trades on a much lower than expected P/E since its forecast growth is higher than the wider market. There could be some major unobserved threats to earnings preventing the P/E ratio from matching the positive outlook. At least price risks look to be very low, but investors seem to think future earnings could see a lot of volatility.
The company's balance sheet is another key area for risk analysis. Our free balance sheet analysis for Nancal TechnologyLtd with six simple checks will allow you to discover any risks that could be an issue.
You might be able to find a better investment than Nancal TechnologyLtd. If you want a selection of possible candidates, check out this free list of interesting companies that trade on a low P/E (but have proven they can grow earnings).
Valuation is complex, but we're here to simplify it.
Discover if Nancal TechnologyLtd might be undervalued or overvalued with our detailed analysis, featuring fair value estimates, potential risks, dividends, insider trades, and its financial condition.
Access Free AnalysisHave feedback on this article? Concerned about the content? Get in touch with us directly. Alternatively, email editorial-team (at) simplywallst.com.
This article by Simply Wall St is general in nature. We provide commentary based on historical data and analyst forecasts only using an unbiased methodology and our articles are not intended to be financial advice. It does not constitute a recommendation to buy or sell any stock, and does not take account of your objectives, or your financial situation. We aim to bring you long-term focused analysis driven by fundamental data. Note that our analysis may not factor in the latest price-sensitive company announcements or qualitative material. Simply Wall St has no position in any stocks mentioned.
Have feedback on this article? Concerned about the content? Get in touch with us directly. Alternatively, email editorial-team@simplywallst.com
About SHSE:603859
Nancal TechnologyLtd
Provides digital transformation solutions in China and internationally.
Excellent balance sheet with reasonable growth potential.
Market Insights

Advertisement
Community Narratives
RIO is poised to weather a depressed iron ore environment, but commodity diversification comes with lower margins
Fair Value AU$110.51|4.0% overvalued
DU
Community Contributor
The demand for personalized medicine will keep Thermo Fisher Scientific thriving
Fair Value US$540.27|21.5% undervalued
UN
Community Contributor
Silver Play by A Family with 10x Potential
Fair Value UK£24.00|88.8% undervalued
RO
Community Contributor