- China
- /
- Trade Distributors
- /
- SHSE:601061
Estimating The Intrinsic Value Of CITIC Metal Co., Ltd (SHSE:601061)


Key Insights
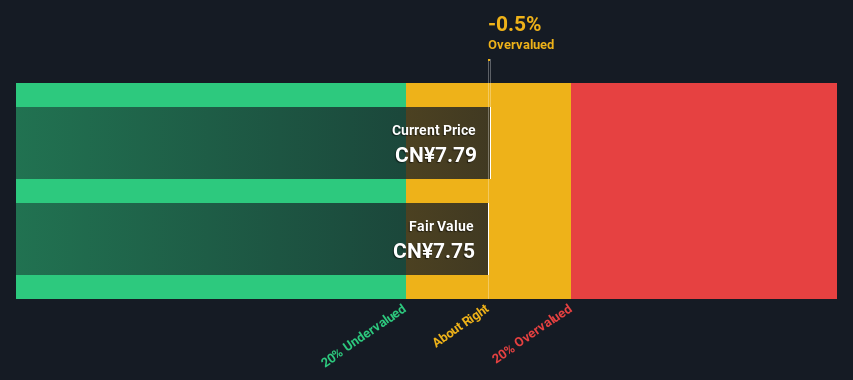
- CITIC Metal's estimated fair value is CN¥7.75 based on 2 Stage Free Cash Flow to Equity
- With CN¥7.79 share price, CITIC Metal appears to be trading close to its estimated fair value
- CITIC Metal's peers seem to be trading at a higher premium to fair value based onthe industry average of -448%
Today we will run through one way of estimating the intrinsic value of CITIC Metal Co., Ltd (SHSE:601061) by projecting its future cash flows and then discounting them to today's value. We will use the Discounted Cash Flow (DCF) model on this occasion. It may sound complicated, but actually it is quite simple!
We would caution that there are many ways of valuing a company and, like the DCF, each technique has advantages and disadvantages in certain scenarios. If you still have some burning questions about this type of valuation, take a look at the Simply Wall St analysis model.
What's The Estimated Valuation?
We are going to use a two-stage DCF model, which, as the name states, takes into account two stages of growth. The first stage is generally a higher growth period which levels off heading towards the terminal value, captured in the second 'steady growth' period. To start off with, we need to estimate the next ten years of cash flows. Seeing as no analyst estimates of free cash flow are available to us, we have extrapolate the previous free cash flow (FCF) from the company's last reported value. We assume companies with shrinking free cash flow will slow their rate of shrinkage, and that companies with growing free cash flow will see their growth rate slow, over this period. We do this to reflect that growth tends to slow more in the early years than it does in later years.
A DCF is all about the idea that a dollar in the future is less valuable than a dollar today, so we discount the value of these future cash flows to their estimated value in today's dollars:
10-year free cash flow (FCF) estimate
| 2025 | 2026 | 2027 | 2028 | 2029 | 2030 | 2031 | 2032 | 2033 | 2034 | |
| Levered FCF (CN¥, Millions) | CN¥1.23b | CN¥1.60b | CN¥1.96b | CN¥2.28b | CN¥2.56b | CN¥2.80b | CN¥3.00b | CN¥3.18b | CN¥3.34b | CN¥3.49b |
| Growth Rate Estimate Source | Est @ 42.44% | Est @ 30.53% | Est @ 22.19% | Est @ 16.36% | Est @ 12.27% | Est @ 9.41% | Est @ 7.41% | Est @ 6.01% | Est @ 5.03% | Est @ 4.34% |
| Present Value (CN¥, Millions) Discounted @ 9.2% | CN¥1.1k | CN¥1.3k | CN¥1.5k | CN¥1.6k | CN¥1.6k | CN¥1.6k | CN¥1.6k | CN¥1.6k | CN¥1.5k | CN¥1.4k |
("Est" = FCF growth rate estimated by Simply Wall St)
Present Value of 10-year Cash Flow (PVCF) = CN¥15b
We now need to calculate the Terminal Value, which accounts for all the future cash flows after this ten year period. The Gordon Growth formula is used to calculate Terminal Value at a future annual growth rate equal to the 5-year average of the 10-year government bond yield of 2.7%. We discount the terminal cash flows to today's value at a cost of equity of 9.2%.
Terminal Value (TV)= FCF2034 × (1 + g) ÷ (r – g) = CN¥3.5b× (1 + 2.7%) ÷ (9.2%– 2.7%) = CN¥55b
Present Value of Terminal Value (PVTV)= TV / (1 + r)10= CN¥55b÷ ( 1 + 9.2%)10= CN¥23b
The total value is the sum of cash flows for the next ten years plus the discounted terminal value, which results in the Total Equity Value, which in this case is CN¥38b. In the final step we divide the equity value by the number of shares outstanding. Relative to the current share price of CN¥7.8, the company appears around fair value at the time of writing. Valuations are imprecise instruments though, rather like a telescope - move a few degrees and end up in a different galaxy. Do keep this in mind.
Important Assumptions
The calculation above is very dependent on two assumptions. The first is the discount rate and the other is the cash flows. You don't have to agree with these inputs, I recommend redoing the calculations yourself and playing with them. The DCF also does not consider the possible cyclicality of an industry, or a company's future capital requirements, so it does not give a full picture of a company's potential performance. Given that we are looking at CITIC Metal as potential shareholders, the cost of equity is used as the discount rate, rather than the cost of capital (or weighted average cost of capital, WACC) which accounts for debt. In this calculation we've used 9.2%, which is based on a levered beta of 1.227. Beta is a measure of a stock's volatility, compared to the market as a whole. We get our beta from the industry average beta of globally comparable companies, with an imposed limit between 0.8 and 2.0, which is a reasonable range for a stable business.
Check out our latest analysis for CITIC Metal
SWOT Analysis for CITIC Metal
- Earnings growth over the past year exceeded the industry.
- Debt is well covered by earnings.
- Dividends are covered by earnings and cash flows.
- Earnings growth over the past year is below its 5-year average.
- Dividend is low compared to the top 25% of dividend payers in the Trade Distributors market.
- Annual earnings are forecast to grow for the next 2 years.
- Good value based on P/E ratio compared to estimated Fair P/E ratio.
- Debt is not well covered by operating cash flow.
Moving On:
Valuation is only one side of the coin in terms of building your investment thesis, and it shouldn't be the only metric you look at when researching a company. DCF models are not the be-all and end-all of investment valuation. Preferably you'd apply different cases and assumptions and see how they would impact the company's valuation. If a company grows at a different rate, or if its cost of equity or risk free rate changes sharply, the output can look very different. For CITIC Metal, we've compiled three essential items you should further examine:
- Financial Health: Does 601061 have a healthy balance sheet? Take a look at our free balance sheet analysis with six simple checks on key factors like leverage and risk.
- Future Earnings: How does 601061's growth rate compare to its peers and the wider market? Dig deeper into the analyst consensus number for the upcoming years by interacting with our free analyst growth expectation chart.
- Other Solid Businesses: Low debt, high returns on equity and good past performance are fundamental to a strong business. Why not explore our interactive list of stocks with solid business fundamentals to see if there are other companies you may not have considered!
PS. Simply Wall St updates its DCF calculation for every Chinese stock every day, so if you want to find the intrinsic value of any other stock just search here.
New: AI Stock Screener & Alerts
Our new AI Stock Screener scans the market every day to uncover opportunities.
• Dividend Powerhouses (3%+ Yield)
• Undervalued Small Caps with Insider Buying
• High growth Tech and AI Companies
Or build your own from over 50 metrics.
Have feedback on this article? Concerned about the content? Get in touch with us directly. Alternatively, email editorial-team (at) simplywallst.com.
This article by Simply Wall St is general in nature. We provide commentary based on historical data and analyst forecasts only using an unbiased methodology and our articles are not intended to be financial advice. It does not constitute a recommendation to buy or sell any stock, and does not take account of your objectives, or your financial situation. We aim to bring you long-term focused analysis driven by fundamental data. Note that our analysis may not factor in the latest price-sensitive company announcements or qualitative material. Simply Wall St has no position in any stocks mentioned.
About SHSE:601061
CITIC Metal
Trades in metals and mineral products in China and internationally.
Undervalued with solid track record.
Market Insights

Community Narratives


