
Advertisement
- China
- /
- Trade Distributors
- /
- SHSE:600180
The Returns On Capital At CCS Supply Chain Management (SHSE:600180) Don't Inspire Confidence
If you're looking for a multi-bagger, there's a few things to keep an eye out for. Ideally, a business will show two trends; firstly a growing return on capital employed (ROCE) and secondly, an increasing amount of capital employed. This shows us that it's a compounding machine, able to continually reinvest its earnings back into the business and generate higher returns. Although, when we looked at CCS Supply Chain Management (SHSE:600180), it didn't seem to tick all of these boxes.
What Is Return On Capital Employed (ROCE)?
Just to clarify if you're unsure, ROCE is a metric for evaluating how much pre-tax income (in percentage terms) a company earns on the capital invested in its business. The formula for this calculation on CCS Supply Chain Management is:
Return on Capital Employed = Earnings Before Interest and Tax (EBIT) ÷ (Total Assets - Current Liabilities)
0.032 = CN¥269m ÷ (CN¥33b - CN¥24b) (Based on the trailing twelve months to September 2023).
Therefore, CCS Supply Chain Management has an ROCE of 3.2%. In absolute terms, that's a low return and it also under-performs the Trade Distributors industry average of 7.3%.
View our latest analysis for CCS Supply Chain Management
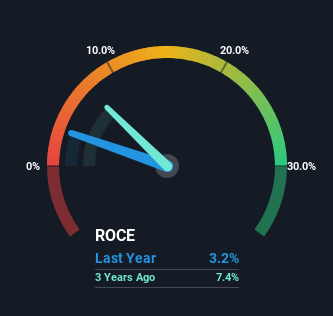
Historical performance is a great place to start when researching a stock so above you can see the gauge for CCS Supply Chain Management's ROCE against it's prior returns. If you'd like to look at how CCS Supply Chain Management has performed in the past in other metrics, you can view this free graph of CCS Supply Chain Management's past earnings, revenue and cash flow.
What Can We Tell From CCS Supply Chain Management's ROCE Trend?
When we looked at the ROCE trend at CCS Supply Chain Management, we didn't gain much confidence. Over the last five years, returns on capital have decreased to 3.2% from 27% five years ago. Meanwhile, the business is utilizing more capital but this hasn't moved the needle much in terms of sales in the past 12 months, so this could reflect longer term investments. It may take some time before the company starts to see any change in earnings from these investments.
On a separate but related note, it's important to know that CCS Supply Chain Management has a current liabilities to total assets ratio of 74%, which we'd consider pretty high. This effectively means that suppliers (or short-term creditors) are funding a large portion of the business, so just be aware that this can introduce some elements of risk. While it's not necessarily a bad thing, it can be beneficial if this ratio is lower.
The Bottom Line
To conclude, we've found that CCS Supply Chain Management is reinvesting in the business, but returns have been falling. And investors appear hesitant that the trends will pick up because the stock has fallen 47% in the last five years. In any case, the stock doesn't have these traits of a multi-bagger discussed above, so if that's what you're looking for, we think you'd have more luck elsewhere.
One more thing, we've spotted 2 warning signs facing CCS Supply Chain Management that you might find interesting.
While CCS Supply Chain Management may not currently earn the highest returns, we've compiled a list of companies that currently earn more than 25% return on equity. Check out this free list here.
New: AI Stock Screener & Alerts
Our new AI Stock Screener scans the market every day to uncover opportunities.
• Dividend Powerhouses (3%+ Yield)
• Undervalued Small Caps with Insider Buying
• High growth Tech and AI Companies
Or build your own from over 50 metrics.
Have feedback on this article? Concerned about the content? Get in touch with us directly. Alternatively, email editorial-team (at) simplywallst.com.
This article by Simply Wall St is general in nature. We provide commentary based on historical data and analyst forecasts only using an unbiased methodology and our articles are not intended to be financial advice. It does not constitute a recommendation to buy or sell any stock, and does not take account of your objectives, or your financial situation. We aim to bring you long-term focused analysis driven by fundamental data. Note that our analysis may not factor in the latest price-sensitive company announcements or qualitative material. Simply Wall St has no position in any stocks mentioned.
About SHSE:600180
CCS Supply Chain Management
Engages in the supply chain management business in China and internationally.
Mediocre balance sheet and slightly overvalued.
Market Insights

Advertisement
Community Narratives
A formidable player in AI and enterprise computing.
Fair Value US$210.00|12.2% overvalued
CO
Community Contributor
IREN's Bold Moves in Sustainable Bitcoin Mining & AI Data Centers
Fair Value US$72.52|17.1% undervalued
BL
Community Contributor
Cooling the Champions: The Aussie Tech Behind F1's Victories
Fair Value AU$12.40|38.7% undervalued
TR
Community Contributor