- China
- /
- Auto Components
- /
- SHSE:603950
Benign Growth For Xiangyang Changyuandonggu Industry Co., Ltd. (SHSE:603950) Underpins Stock's 26% Plummet


Xiangyang Changyuandonggu Industry Co., Ltd. (SHSE:603950) shareholders that were waiting for something to happen have been dealt a blow with a 26% share price drop in the last month. Instead of being rewarded, shareholders who have already held through the last twelve months are now sitting on a 15% share price drop.
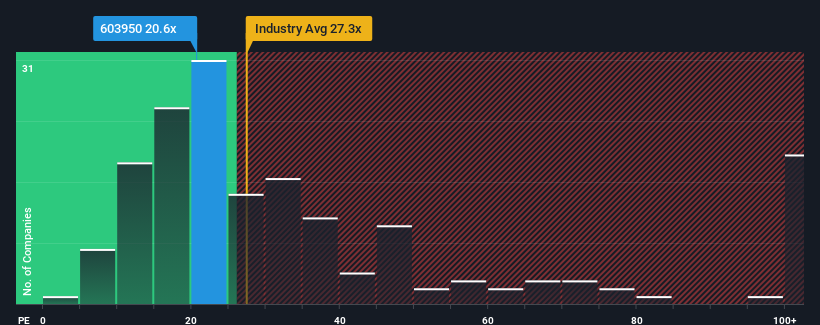
In spite of the heavy fall in price, Xiangyang Changyuandonggu Industry may still be sending bullish signals at the moment with its price-to-earnings (or "P/E") ratio of 20.6x, since almost half of all companies in China have P/E ratios greater than 30x and even P/E's higher than 56x are not unusual. Although, it's not wise to just take the P/E at face value as there may be an explanation why it's limited.
Recent times have been quite advantageous for Xiangyang Changyuandonggu Industry as its earnings have been rising very briskly. One possibility is that the P/E is low because investors think this strong earnings growth might actually underperform the broader market in the near future. If that doesn't eventuate, then existing shareholders have reason to be quite optimistic about the future direction of the share price.
View our latest analysis for Xiangyang Changyuandonggu Industry
How Is Xiangyang Changyuandonggu Industry's Growth Trending?
The only time you'd be truly comfortable seeing a P/E as low as Xiangyang Changyuandonggu Industry's is when the company's growth is on track to lag the market.
Taking a look back first, we see that the company grew earnings per share by an impressive 78% last year. Still, incredibly EPS has fallen 49% in total from three years ago, which is quite disappointing. Therefore, it's fair to say the earnings growth recently has been undesirable for the company.
Comparing that to the market, which is predicted to deliver 36% growth in the next 12 months, the company's downward momentum based on recent medium-term earnings results is a sobering picture.
In light of this, it's understandable that Xiangyang Changyuandonggu Industry's P/E would sit below the majority of other companies. Nonetheless, there's no guarantee the P/E has reached a floor yet with earnings going in reverse. Even just maintaining these prices could be difficult to achieve as recent earnings trends are already weighing down the shares.
What We Can Learn From Xiangyang Changyuandonggu Industry's P/E?
Xiangyang Changyuandonggu Industry's P/E has taken a tumble along with its share price. Using the price-to-earnings ratio alone to determine if you should sell your stock isn't sensible, however it can be a practical guide to the company's future prospects.
We've established that Xiangyang Changyuandonggu Industry maintains its low P/E on the weakness of its sliding earnings over the medium-term, as expected. At this stage investors feel the potential for an improvement in earnings isn't great enough to justify a higher P/E ratio. Unless the recent medium-term conditions improve, they will continue to form a barrier for the share price around these levels.
We don't want to rain on the parade too much, but we did also find 3 warning signs for Xiangyang Changyuandonggu Industry that you need to be mindful of.
It's important to make sure you look for a great company, not just the first idea you come across. So take a peek at this free list of interesting companies with strong recent earnings growth (and a low P/E).
New: AI Stock Screener & Alerts
Our new AI Stock Screener scans the market every day to uncover opportunities.
• Dividend Powerhouses (3%+ Yield)
• Undervalued Small Caps with Insider Buying
• High growth Tech and AI Companies
Or build your own from over 50 metrics.
Have feedback on this article? Concerned about the content? Get in touch with us directly. Alternatively, email editorial-team (at) simplywallst.com.
This article by Simply Wall St is general in nature. We provide commentary based on historical data and analyst forecasts only using an unbiased methodology and our articles are not intended to be financial advice. It does not constitute a recommendation to buy or sell any stock, and does not take account of your objectives, or your financial situation. We aim to bring you long-term focused analysis driven by fundamental data. Note that our analysis may not factor in the latest price-sensitive company announcements or qualitative material. Simply Wall St has no position in any stocks mentioned.
Have feedback on this article? Concerned about the content? Get in touch with us directly. Alternatively, email editorial-team@simplywallst.com
About SHSE:603950
Xiangyang Changyuandonggu Industry
Xiangyang Changyuandonggu Industry Co., Ltd.
Flawless balance sheet with acceptable track record.
Market Insights

Community Narratives


