
Advertisement
- China
- /
- Auto Components
- /
- SHSE:603950
Additional Considerations Required While Assessing Xiangyang Changyuandonggu Industry's (SHSE:603950) Strong Earnings

Investors were disappointed with Xiangyang Changyuandonggu Industry Co., Ltd.'s (SHSE:603950) earnings, despite the strong profit numbers. We did some digging and found some worrying underlying problems.
Check out our latest analysis for Xiangyang Changyuandonggu Industry
Zooming In On Xiangyang Changyuandonggu Industry's Earnings
In high finance, the key ratio used to measure how well a company converts reported profits into free cash flow (FCF) is the accrual ratio (from cashflow). The accrual ratio subtracts the FCF from the profit for a given period, and divides the result by the average operating assets of the company over that time. You could think of the accrual ratio from cashflow as the 'non-FCF profit ratio'.
That means a negative accrual ratio is a good thing, because it shows that the company is bringing in more free cash flow than its profit would suggest. While it's not a problem to have a positive accrual ratio, indicating a certain level of non-cash profits, a high accrual ratio is arguably a bad thing, because it indicates paper profits are not matched by cash flow. To quote a 2014 paper by Lewellen and Resutek, "firms with higher accruals tend to be less profitable in the future".
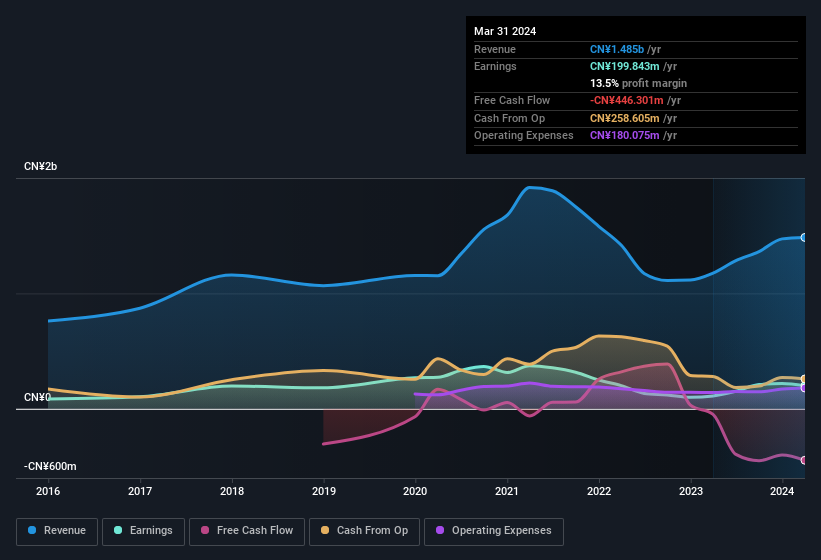
Xiangyang Changyuandonggu Industry has an accrual ratio of 0.26 for the year to March 2024. We can therefore deduce that its free cash flow fell well short of covering its statutory profit. Over the last year it actually had negative free cash flow of CN¥446m, in contrast to the aforementioned profit of CN¥199.8m. Coming off the back of negative free cash flow last year, we imagine some shareholders might wonder if its cash burn of CN¥446m, this year, indicates high risk.
Note: we always recommend investors check balance sheet strength. Click here to be taken to our balance sheet analysis of Xiangyang Changyuandonggu Industry.
Our Take On Xiangyang Changyuandonggu Industry's Profit Performance
Xiangyang Changyuandonggu Industry's accrual ratio for the last twelve months signifies cash conversion is less than ideal, which is a negative when it comes to our view of its earnings. Therefore, it seems possible to us that Xiangyang Changyuandonggu Industry's true underlying earnings power is actually less than its statutory profit. But at least holders can take some solace from the 68% EPS growth in the last year. The goal of this article has been to assess how well we can rely on the statutory earnings to reflect the company's potential, but there is plenty more to consider. If you want to do dive deeper into Xiangyang Changyuandonggu Industry, you'd also look into what risks it is currently facing. Case in point: We've spotted 3 warning signs for Xiangyang Changyuandonggu Industry you should be mindful of and 2 of them make us uncomfortable.
Today we've zoomed in on a single data point to better understand the nature of Xiangyang Changyuandonggu Industry's profit. But there are plenty of other ways to inform your opinion of a company. For example, many people consider a high return on equity as an indication of favorable business economics, while others like to 'follow the money' and search out stocks that insiders are buying. While it might take a little research on your behalf, you may find this free collection of companies boasting high return on equity, or this list of stocks that insiders are buying to be useful.
New: AI Stock Screener & Alerts
Our new AI Stock Screener scans the market every day to uncover opportunities.
• Dividend Powerhouses (3%+ Yield)
• Undervalued Small Caps with Insider Buying
• High growth Tech and AI Companies
Or build your own from over 50 metrics.
Have feedback on this article? Concerned about the content? Get in touch with us directly. Alternatively, email editorial-team (at) simplywallst.com.
This article by Simply Wall St is general in nature. We provide commentary based on historical data and analyst forecasts only using an unbiased methodology and our articles are not intended to be financial advice. It does not constitute a recommendation to buy or sell any stock, and does not take account of your objectives, or your financial situation. We aim to bring you long-term focused analysis driven by fundamental data. Note that our analysis may not factor in the latest price-sensitive company announcements or qualitative material. Simply Wall St has no position in any stocks mentioned.
About SHSE:603950
Xiangyang Changyuandonggu Industry
Xiangyang Changyuandonggu Industry Co., Ltd.
Flawless balance sheet with high growth potential.
Market Insights


Advertisement
Community Narratives
Pole position to benefit from GENIUS Act
Fair Value US$233.04|58.8% undervalued
CH
Community Contributor
IREN will transform from bitcoin miner to leader in AI infrastructure
Fair Value US$21.48|17.5% undervalued
KA
Community Contributor
Behind the Assay: XRF Scientific’s Role in Modern Mining Economics
Fair Value AU$2.10|2.4% undervalued
RO
Community Contributor