- China
- /
- Auto Components
- /
- SHSE:601689
Does Ningbo Tuopu GroupLtd (SHSE:601689) Have A Healthy Balance Sheet?


Howard Marks put it nicely when he said that, rather than worrying about share price volatility, 'The possibility of permanent loss is the risk I worry about... and every practical investor I know worries about.' It's only natural to consider a company's balance sheet when you examine how risky it is, since debt is often involved when a business collapses. Importantly, Ningbo Tuopu Group Co.,Ltd. (SHSE:601689) does carry debt. But should shareholders be worried about its use of debt?
Why Does Debt Bring Risk?
Debt is a tool to help businesses grow, but if a business is incapable of paying off its lenders, then it exists at their mercy. Ultimately, if the company can't fulfill its legal obligations to repay debt, shareholders could walk away with nothing. However, a more common (but still painful) scenario is that it has to raise new equity capital at a low price, thus permanently diluting shareholders. Of course, debt can be an important tool in businesses, particularly capital heavy businesses. The first step when considering a company's debt levels is to consider its cash and debt together.
View our latest analysis for Ningbo Tuopu GroupLtd
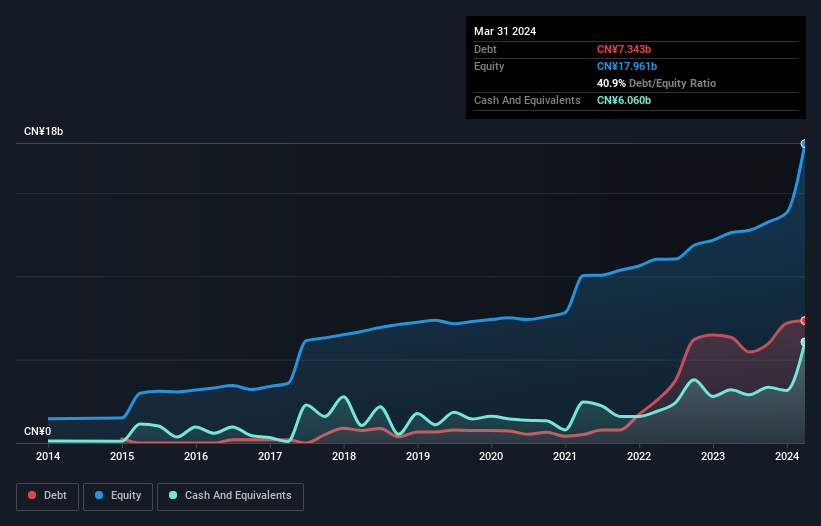
What Is Ningbo Tuopu GroupLtd's Debt?
You can click the graphic below for the historical numbers, but it shows that as of March 2024 Ningbo Tuopu GroupLtd had CN¥7.34b of debt, an increase on CN¥6.34b, over one year. On the flip side, it has CN¥6.06b in cash leading to net debt of about CN¥1.28b.
How Healthy Is Ningbo Tuopu GroupLtd's Balance Sheet?
Zooming in on the latest balance sheet data, we can see that Ningbo Tuopu GroupLtd had liabilities of CN¥12.3b due within 12 months and liabilities of CN¥4.42b due beyond that. On the other hand, it had cash of CN¥6.06b and CN¥6.74b worth of receivables due within a year. So it has liabilities totalling CN¥3.96b more than its cash and near-term receivables, combined.
Given Ningbo Tuopu GroupLtd has a market capitalization of CN¥67.5b, it's hard to believe these liabilities pose much threat. But there are sufficient liabilities that we would certainly recommend shareholders continue to monitor the balance sheet, going forward.
We use two main ratios to inform us about debt levels relative to earnings. The first is net debt divided by earnings before interest, tax, depreciation, and amortization (EBITDA), while the second is how many times its earnings before interest and tax (EBIT) covers its interest expense (or its interest cover, for short). Thus we consider debt relative to earnings both with and without depreciation and amortization expenses.
Ningbo Tuopu GroupLtd has a low net debt to EBITDA ratio of only 0.33. And its EBIT easily covers its interest expense, being 14.9 times the size. So you could argue it is no more threatened by its debt than an elephant is by a mouse. Another good sign is that Ningbo Tuopu GroupLtd has been able to increase its EBIT by 30% in twelve months, making it easier to pay down debt. The balance sheet is clearly the area to focus on when you are analysing debt. But ultimately the future profitability of the business will decide if Ningbo Tuopu GroupLtd can strengthen its balance sheet over time. So if you want to see what the professionals think, you might find this free report on analyst profit forecasts to be interesting.
But our final consideration is also important, because a company cannot pay debt with paper profits; it needs cold hard cash. So we clearly need to look at whether that EBIT is leading to corresponding free cash flow. Over the last three years, Ningbo Tuopu GroupLtd saw substantial negative free cash flow, in total. While investors are no doubt expecting a reversal of that situation in due course, it clearly does mean its use of debt is more risky.
Our View
The good news is that Ningbo Tuopu GroupLtd's demonstrated ability to cover its interest expense with its EBIT delights us like a fluffy puppy does a toddler. But we must concede we find its conversion of EBIT to free cash flow has the opposite effect. Looking at all the aforementioned factors together, it strikes us that Ningbo Tuopu GroupLtd can handle its debt fairly comfortably. Of course, while this leverage can enhance returns on equity, it does bring more risk, so it's worth keeping an eye on this one. The balance sheet is clearly the area to focus on when you are analysing debt. However, not all investment risk resides within the balance sheet - far from it. Be aware that Ningbo Tuopu GroupLtd is showing 2 warning signs in our investment analysis , you should know about...
At the end of the day, it's often better to focus on companies that are free from net debt. You can access our special list of such companies (all with a track record of profit growth). It's free.
Valuation is complex, but we're here to simplify it.
Discover if Ningbo Tuopu GroupLtd might be undervalued or overvalued with our detailed analysis, featuring fair value estimates, potential risks, dividends, insider trades, and its financial condition.
Access Free AnalysisHave feedback on this article? Concerned about the content? Get in touch with us directly. Alternatively, email editorial-team (at) simplywallst.com.
This article by Simply Wall St is general in nature. We provide commentary based on historical data and analyst forecasts only using an unbiased methodology and our articles are not intended to be financial advice. It does not constitute a recommendation to buy or sell any stock, and does not take account of your objectives, or your financial situation. We aim to bring you long-term focused analysis driven by fundamental data. Note that our analysis may not factor in the latest price-sensitive company announcements or qualitative material. Simply Wall St has no position in any stocks mentioned.
Have feedback on this article? Concerned about the content? Get in touch with us directly. Alternatively, email editorial-team@simplywallst.com
About SHSE:601689
Ningbo Tuopu GroupLtd
Engages in the research and development, production, and sale of auto parts in China and internationally.
Undervalued with high growth potential.
Market Insights

Community Narratives
