- Canada
- /
- Renewable Energy
- /
- TSX:PIF
Polaris Renewable Energy (TSE:PIF) Has A Somewhat Strained Balance Sheet

The external fund manager backed by Berkshire Hathaway's Charlie Munger, Li Lu, makes no bones about it when he says 'The biggest investment risk is not the volatility of prices, but whether you will suffer a permanent loss of capital.' It's only natural to consider a company's balance sheet when you examine how risky it is, since debt is often involved when a business collapses. As with many other companies Polaris Renewable Energy Inc. (TSE:PIF) makes use of debt. But should shareholders be worried about its use of debt?
When Is Debt Dangerous?
Debt is a tool to help businesses grow, but if a business is incapable of paying off its lenders, then it exists at their mercy. In the worst case scenario, a company can go bankrupt if it cannot pay its creditors. However, a more frequent (but still costly) occurrence is where a company must issue shares at bargain-basement prices, permanently diluting shareholders, just to shore up its balance sheet. By replacing dilution, though, debt can be an extremely good tool for businesses that need capital to invest in growth at high rates of return. When we think about a company's use of debt, we first look at cash and debt together.
View our latest analysis for Polaris Renewable Energy
What Is Polaris Renewable Energy's Net Debt?
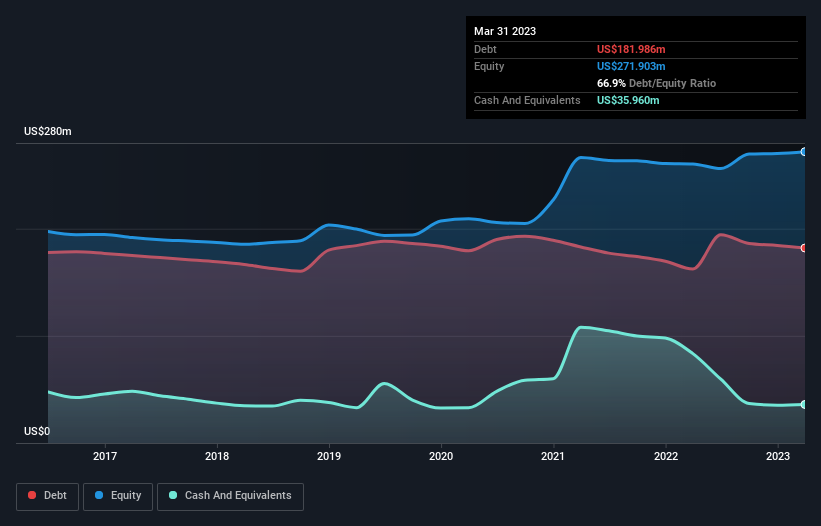
You can click the graphic below for the historical numbers, but it shows that as of March 2023 Polaris Renewable Energy had US$182.0m of debt, an increase on US$162.4m, over one year. However, it does have US$36.0m in cash offsetting this, leading to net debt of about US$146.0m.
A Look At Polaris Renewable Energy's Liabilities
Zooming in on the latest balance sheet data, we can see that Polaris Renewable Energy had liabilities of US$28.5m due within 12 months and liabilities of US$230.7m due beyond that. Offsetting these obligations, it had cash of US$36.0m as well as receivables valued at US$11.9m due within 12 months. So its liabilities total US$211.4m more than the combination of its cash and short-term receivables.
This deficit is considerable relative to its market capitalization of US$234.2m, so it does suggest shareholders should keep an eye on Polaris Renewable Energy's use of debt. This suggests shareholders would be heavily diluted if the company needed to shore up its balance sheet in a hurry.
In order to size up a company's debt relative to its earnings, we calculate its net debt divided by its earnings before interest, tax, depreciation, and amortization (EBITDA) and its earnings before interest and tax (EBIT) divided by its interest expense (its interest cover). This way, we consider both the absolute quantum of the debt, as well as the interest rates paid on it.
While Polaris Renewable Energy's debt to EBITDA ratio (3.1) suggests that it uses some debt, its interest cover is very weak, at 1.7, suggesting high leverage. It seems that the business incurs large depreciation and amortisation charges, so maybe its debt load is heavier than it would first appear, since EBITDA is arguably a generous measure of earnings. So shareholders should probably be aware that interest expenses appear to have really impacted the business lately. On a slightly more positive note, Polaris Renewable Energy grew its EBIT at 14% over the last year, further increasing its ability to manage debt. When analysing debt levels, the balance sheet is the obvious place to start. But ultimately the future profitability of the business will decide if Polaris Renewable Energy can strengthen its balance sheet over time. So if you want to see what the professionals think, you might find this free report on analyst profit forecasts to be interesting.
But our final consideration is also important, because a company cannot pay debt with paper profits; it needs cold hard cash. So the logical step is to look at the proportion of that EBIT that is matched by actual free cash flow. Happily for any shareholders, Polaris Renewable Energy actually produced more free cash flow than EBIT over the last three years. That sort of strong cash conversion gets us as excited as the crowd when the beat drops at a Daft Punk concert.
Our View
Neither Polaris Renewable Energy's ability to cover its interest expense with its EBIT nor its level of total liabilities gave us confidence in its ability to take on more debt. But the good news is it seems to be able to convert EBIT to free cash flow with ease. We think that Polaris Renewable Energy's debt does make it a bit risky, after considering the aforementioned data points together. Not all risk is bad, as it can boost share price returns if it pays off, but this debt risk is worth keeping in mind. The balance sheet is clearly the area to focus on when you are analysing debt. But ultimately, every company can contain risks that exist outside of the balance sheet. For example, we've discovered 4 warning signs for Polaris Renewable Energy (2 are concerning!) that you should be aware of before investing here.
At the end of the day, it's often better to focus on companies that are free from net debt. You can access our special list of such companies (all with a track record of profit growth). It's free.
The New Payments ETF Is Live on NASDAQ:
Money is moving to real-time rails, and a newly listed ETF now gives investors direct exposure. Fast settlement. Institutional custody. Simple access.
Explore how this launch could reshape portfolios
Sponsored ContentNew: Manage All Your Stock Portfolios in One Place
We've created the ultimate portfolio companion for stock investors, and it's free.
• Connect an unlimited number of Portfolios and see your total in one currency
• Be alerted to new Warning Signs or Risks via email or mobile
• Track the Fair Value of your stocks
Have feedback on this article? Concerned about the content? Get in touch with us directly. Alternatively, email editorial-team (at) simplywallst.com.
This article by Simply Wall St is general in nature. We provide commentary based on historical data and analyst forecasts only using an unbiased methodology and our articles are not intended to be financial advice. It does not constitute a recommendation to buy or sell any stock, and does not take account of your objectives, or your financial situation. We aim to bring you long-term focused analysis driven by fundamental data. Note that our analysis may not factor in the latest price-sensitive company announcements or qualitative material. Simply Wall St has no position in any stocks mentioned.
About TSX:PIF
Polaris Renewable Energy
Engages in the acquisition, exploration, development, and operation of renewable energy projects in Latin America and the Caribbean.
Undervalued established dividend payer.
Similar Companies
Market Insights

Weekly Picks

THE KINGDOM OF BROWN GOODS: WHY MGPI IS BEING CRUSHED BY INVENTORY & PRIMED FOR RESURRECTION


Why Vertical Aerospace (NYSE: EVTL) is Worth Possibly Over 13x its Current Price


The Quiet Giant That Became AI’s Power Grid
Recently Updated Narratives

Agfa-Gevaert is a digital and materials turnaround opportunity, with growth potential in ZIRFON, but carrying legacy risks.

Hitit Bilgisayar Hizmetleri will achieve a 19.7% revenue boost in the next five years


MINISO's fair value is projected at 26.69 with an anticipated PE ratio shift of 20x
Popular Narratives


MicroVision will explode future revenue by 380.37% with a vision towards success


Crazy Undervalued 42 Baggers Silver Play (Active & Running Mine)


