- Canada
- /
- Communications
- /
- TSX:VCM
Vecima Networks Inc.'s (TSE:VCM) Stock Has Seen Strong Momentum: Does That Call For Deeper Study Of Its Financial Prospects?

Vecima Networks (TSE:VCM) has had a great run on the share market with its stock up by a significant 32% over the last three months. We wonder if and what role the company's financials play in that price change as a company's long-term fundamentals usually dictate market outcomes. Specifically, we decided to study Vecima Networks' ROE in this article.
Return on equity or ROE is an important factor to be considered by a shareholder because it tells them how effectively their capital is being reinvested. In short, ROE shows the profit each dollar generates with respect to its shareholder investments.
Check out our latest analysis for Vecima Networks
How Do You Calculate Return On Equity?
The formula for ROE is:
Return on Equity = Net Profit (from continuing operations) ÷ Shareholders' Equity
So, based on the above formula, the ROE for Vecima Networks is:
6.7% = CA$15m ÷ CA$221m (Based on the trailing twelve months to December 2023).
The 'return' is the income the business earned over the last year. Another way to think of that is that for every CA$1 worth of equity, the company was able to earn CA$0.07 in profit.
What Has ROE Got To Do With Earnings Growth?
So far, we've learned that ROE is a measure of a company's profitability. Based on how much of its profits the company chooses to reinvest or "retain", we are then able to evaluate a company's future ability to generate profits. Assuming all else is equal, companies that have both a higher return on equity and higher profit retention are usually the ones that have a higher growth rate when compared to companies that don't have the same features.
A Side By Side comparison of Vecima Networks' Earnings Growth And 6.7% ROE
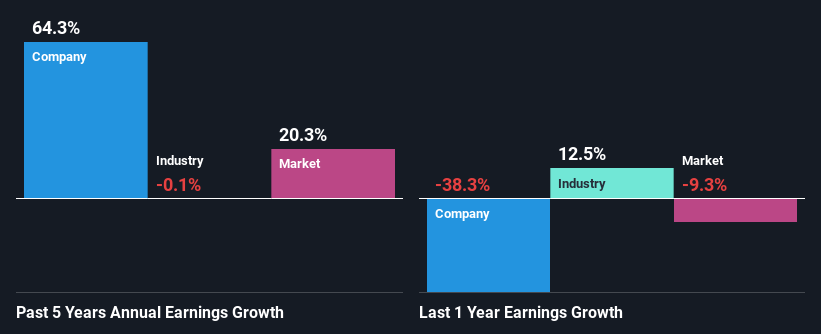
At first glance, Vecima Networks' ROE doesn't look very promising. Yet, a closer study shows that the company's ROE is similar to the industry average of 6.7%. Particularly, the exceptional 64% net income growth seen by Vecima Networks over the past five years is pretty remarkable. Given the slightly low ROE, it is likely that there could be some other aspects that are driving this growth. For instance, the company has a low payout ratio or is being managed efficiently.
Next, on comparing with the industry net income growth, we found that the growth figure reported by Vecima Networks compares quite favourably to the industry average, which shows a decline of 0.1% over the last few years.
The basis for attaching value to a company is, to a great extent, tied to its earnings growth. It’s important for an investor to know whether the market has priced in the company's expected earnings growth (or decline). This then helps them determine if the stock is placed for a bright or bleak future. If you're wondering about Vecima Networks''s valuation, check out this gauge of its price-to-earnings ratio, as compared to its industry.
Is Vecima Networks Making Efficient Use Of Its Profits?
Vecima Networks' ' three-year median payout ratio is on the lower side at 21% implying that it is retaining a higher percentage (79%) of its profits. This suggests that the management is reinvesting most of the profits to grow the business as evidenced by the growth seen by the company.
Additionally, Vecima Networks has paid dividends over a period of at least ten years which means that the company is pretty serious about sharing its profits with shareholders.
Summary
Overall, we feel that Vecima Networks certainly does have some positive factors to consider. Even in spite of the low rate of return, the company has posted impressive earnings growth as a result of reinvesting heavily into its business. On studying current analyst estimates, we found that analysts expect the company to continue its recent growth streak. Are these analysts expectations based on the broad expectations for the industry, or on the company's fundamentals? Click here to be taken to our analyst's forecasts page for the company.
The New Payments ETF Is Live on NASDAQ:
Money is moving to real-time rails, and a newly listed ETF now gives investors direct exposure. Fast settlement. Institutional custody. Simple access.
Explore how this launch could reshape portfolios
Sponsored ContentNew: Manage All Your Stock Portfolios in One Place
We've created the ultimate portfolio companion for stock investors, and it's free.
• Connect an unlimited number of Portfolios and see your total in one currency
• Be alerted to new Warning Signs or Risks via email or mobile
• Track the Fair Value of your stocks
Have feedback on this article? Concerned about the content? Get in touch with us directly. Alternatively, email editorial-team (at) simplywallst.com.
This article by Simply Wall St is general in nature. We provide commentary based on historical data and analyst forecasts only using an unbiased methodology and our articles are not intended to be financial advice. It does not constitute a recommendation to buy or sell any stock, and does not take account of your objectives, or your financial situation. We aim to bring you long-term focused analysis driven by fundamental data. Note that our analysis may not factor in the latest price-sensitive company announcements or qualitative material. Simply Wall St has no position in any stocks mentioned.
About TSX:VCM
Vecima Networks
Engages in the development of integrated hardware and software solutions for broadband access, content delivery, and telematics.
Very undervalued with adequate balance sheet and pays a dividend.
Similar Companies
Market Insights

Weekly Picks

THE KINGDOM OF BROWN GOODS: WHY MGPI IS BEING CRUSHED BY INVENTORY & PRIMED FOR RESURRECTION


Why Vertical Aerospace (NYSE: EVTL) is Worth Possibly Over 13x its Current Price


The Quiet Giant That Became AI’s Power Grid
Recently Updated Narratives


A case for USD $14.81 per share based on book value. Be warned, this is a micro-cap dependent on a single mine.

Occidental Petroleum to Become Fairly Priced at $68.29 According to Future Projections

Agfa-Gevaert is a digital and materials turnaround opportunity, with growth potential in ZIRFON, but carrying legacy risks.
Popular Narratives


MicroVision will explode future revenue by 380.37% with a vision towards success


Crazy Undervalued 42 Baggers Silver Play (Active & Running Mine)


