
David Iben put it well when he said, 'Volatility is not a risk we care about. What we care about is avoiding the permanent loss of capital.' So it might be obvious that you need to consider debt, when you think about how risky any given stock is, because too much debt can sink a company. We can see that Sangoma Technologies Corporation (TSE:STC) does use debt in its business. But the real question is whether this debt is making the company risky.
Why Does Debt Bring Risk?
Debt is a tool to help businesses grow, but if a business is incapable of paying off its lenders, then it exists at their mercy. Ultimately, if the company can't fulfill its legal obligations to repay debt, shareholders could walk away with nothing. However, a more common (but still painful) scenario is that it has to raise new equity capital at a low price, thus permanently diluting shareholders. Of course, the upside of debt is that it often represents cheap capital, especially when it replaces dilution in a company with the ability to reinvest at high rates of return. The first step when considering a company's debt levels is to consider its cash and debt together.
See our latest analysis for Sangoma Technologies
How Much Debt Does Sangoma Technologies Carry?
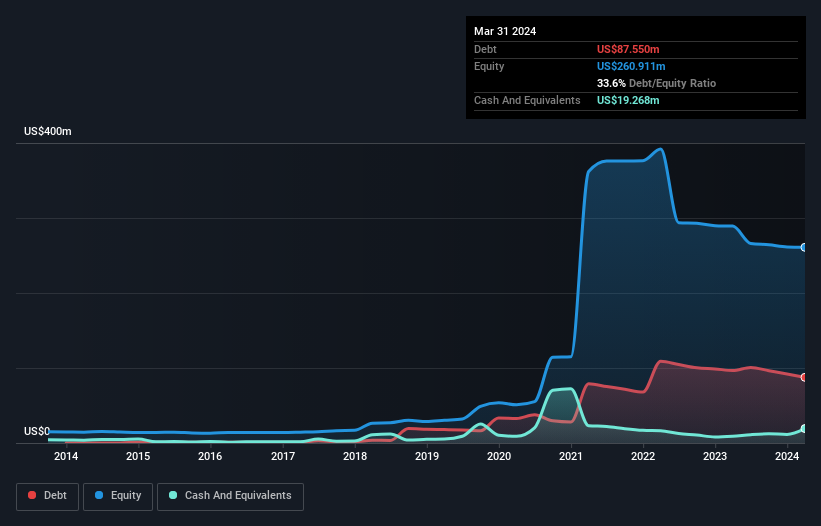
You can click the graphic below for the historical numbers, but it shows that Sangoma Technologies had US$87.6m of debt in March 2024, down from US$96.7m, one year before. However, because it has a cash reserve of US$19.3m, its net debt is less, at about US$68.3m.
How Strong Is Sangoma Technologies' Balance Sheet?
The latest balance sheet data shows that Sangoma Technologies had liabilities of US$59.3m due within a year, and liabilities of US$93.9m falling due after that. On the other hand, it had cash of US$19.3m and US$22.2m worth of receivables due within a year. So it has liabilities totalling US$111.7m more than its cash and near-term receivables, combined.
This deficit is considerable relative to its market capitalization of US$158.3m, so it does suggest shareholders should keep an eye on Sangoma Technologies' use of debt. This suggests shareholders would be heavily diluted if the company needed to shore up its balance sheet in a hurry. The balance sheet is clearly the area to focus on when you are analysing debt. But ultimately the future profitability of the business will decide if Sangoma Technologies can strengthen its balance sheet over time. So if you want to see what the professionals think, you might find this free report on analyst profit forecasts to be interesting.
Over 12 months, Sangoma Technologies made a loss at the EBIT level, and saw its revenue drop to US$250m, which is a fall of 2.0%. We would much prefer see growth.
Caveat Emptor
Over the last twelve months Sangoma Technologies produced an earnings before interest and tax (EBIT) loss. Indeed, it lost US$2.8m at the EBIT level. When we look at that and recall the liabilities on its balance sheet, relative to cash, it seems unwise to us for the company to have any debt. So we think its balance sheet is a little strained, though not beyond repair. We would feel better if it turned its trailing twelve month loss of US$31m into a profit. So in short it's a really risky stock. The balance sheet is clearly the area to focus on when you are analysing debt. But ultimately, every company can contain risks that exist outside of the balance sheet. Case in point: We've spotted 1 warning sign for Sangoma Technologies you should be aware of.
Of course, if you're the type of investor who prefers buying stocks without the burden of debt, then don't hesitate to discover our exclusive list of net cash growth stocks, today.
Mobile Infrastructure for Defense and Disaster
The next wave in robotics isn't humanoid. Its fully autonomous towers delivering 5G, ISR, and radar in under 30 minutes, anywhere.
Get the investor briefing before the next round of contracts
Sponsored On Behalf of CiTechNew: Manage All Your Stock Portfolios in One Place
We've created the ultimate portfolio companion for stock investors, and it's free.
• Connect an unlimited number of Portfolios and see your total in one currency
• Be alerted to new Warning Signs or Risks via email or mobile
• Track the Fair Value of your stocks
Have feedback on this article? Concerned about the content? Get in touch with us directly. Alternatively, email editorial-team (at) simplywallst.com.
This article by Simply Wall St is general in nature. We provide commentary based on historical data and analyst forecasts only using an unbiased methodology and our articles are not intended to be financial advice. It does not constitute a recommendation to buy or sell any stock, and does not take account of your objectives, or your financial situation. We aim to bring you long-term focused analysis driven by fundamental data. Note that our analysis may not factor in the latest price-sensitive company announcements or qualitative material. Simply Wall St has no position in any stocks mentioned.
Have feedback on this article? Concerned about the content? Get in touch with us directly. Alternatively, email editorial-team@simplywallst.com
About TSX:STC
Sangoma Technologies
Develops, manufactures, distributes, and supports voice and data connectivity components for software-based communication applications in the United States of America and internationally.
Very undervalued with excellent balance sheet.
Similar Companies
Market Insights

Weekly Picks

THE KINGDOM OF BROWN GOODS: WHY MGPI IS BEING CRUSHED BY INVENTORY & PRIMED FOR RESURRECTION


Why Vertical Aerospace (NYSE: EVTL) is Worth Possibly Over 13x its Current Price


The Quiet Giant That Became AI’s Power Grid
Recently Updated Narratives


MINISO's fair value is projected at 26.69 with an anticipated PE ratio shift of 20x

Fiverr International will transform the freelance industry with AI-powered growth

Stride Stock: Online Education Finds Its Second Act
Popular Narratives


MicroVision will explode future revenue by 380.37% with a vision towards success


Crazy Undervalued 42 Baggers Silver Play (Active & Running Mine)


