- Canada
- /
- Specialty Stores
- /
- TSXV:BILD
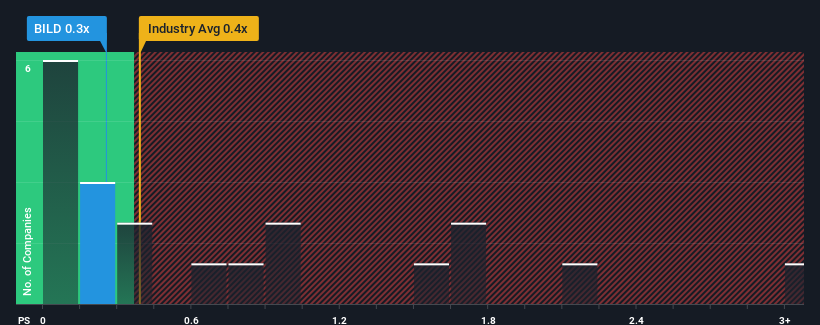
What BuildDirect.com Technologies Inc.'s (CVE:BILD) P/S Is Not Telling You

With a median price-to-sales (or "P/S") ratio of close to 0.7x in the Specialty Retail industry in Canada, you could be forgiven for feeling indifferent about BuildDirect.com Technologies Inc.'s (CVE:BILD) P/S ratio of 0.3x. However, investors might be overlooking a clear opportunity or potential setback if there is no rational basis for the P/S.
Check out our latest analysis for BuildDirect.com Technologies
What Does BuildDirect.com Technologies' P/S Mean For Shareholders?
BuildDirect.com Technologies hasn't been tracking well recently as its declining revenue compares poorly to other companies, which have seen some growth in their revenues on average. It might be that many expect the dour revenue performance to strengthen positively, which has kept the P/S from falling. You'd really hope so, otherwise you're paying a relatively elevated price for a company with this sort of growth profile.
Keen to find out how analysts think BuildDirect.com Technologies' future stacks up against the industry? In that case, our free report is a great place to start.Is There Some Revenue Growth Forecasted For BuildDirect.com Technologies?
There's an inherent assumption that a company should be matching the industry for P/S ratios like BuildDirect.com Technologies' to be considered reasonable.
Taking a look back first, the company's revenue growth last year wasn't something to get excited about as it posted a disappointing decline of 22%. Even so, admirably revenue has lifted 39% in aggregate from three years ago, notwithstanding the last 12 months. Accordingly, while they would have preferred to keep the run going, shareholders would definitely welcome the medium-term rates of revenue growth.
Shifting to the future, estimates from the lone analyst covering the company suggest revenue growth is heading into negative territory, declining 17% over the next year. With the industry predicted to deliver 8.2% growth, that's a disappointing outcome.
With this information, we find it concerning that BuildDirect.com Technologies is trading at a fairly similar P/S compared to the industry. Apparently many investors in the company reject the analyst cohort's pessimism and aren't willing to let go of their stock right now. There's a good chance these shareholders are setting themselves up for future disappointment if the P/S falls to levels more in line with the negative growth outlook.
What We Can Learn From BuildDirect.com Technologies' P/S?
We'd say the price-to-sales ratio's power isn't primarily as a valuation instrument but rather to gauge current investor sentiment and future expectations.
It appears that BuildDirect.com Technologies currently trades on a higher than expected P/S for a company whose revenues are forecast to decline. When we see a gloomy outlook like this, our immediate thoughts are that the share price is at risk of declining, negatively impacting P/S. If we consider the revenue outlook, the P/S seems to indicate that potential investors may be paying a premium for the stock.
It is also worth noting that we have found 2 warning signs for BuildDirect.com Technologies (1 can't be ignored!) that you need to take into consideration.
If companies with solid past earnings growth is up your alley, you may wish to see this free collection of other companies with strong earnings growth and low P/E ratios.
Mobile Infrastructure for Defense and Disaster
The next wave in robotics isn't humanoid. Its fully autonomous towers delivering 5G, ISR, and radar in under 30 minutes, anywhere.
Get the investor briefing before the next round of contracts
Sponsored On Behalf of CiTechValuation is complex, but we're here to simplify it.
Discover if BuildDirect.com Technologies might be undervalued or overvalued with our detailed analysis, featuring fair value estimates, potential risks, dividends, insider trades, and its financial condition.
Access Free AnalysisHave feedback on this article? Concerned about the content? Get in touch with us directly. Alternatively, email editorial-team (at) simplywallst.com.
This article by Simply Wall St is general in nature. We provide commentary based on historical data and analyst forecasts only using an unbiased methodology and our articles are not intended to be financial advice. It does not constitute a recommendation to buy or sell any stock, and does not take account of your objectives, or your financial situation. We aim to bring you long-term focused analysis driven by fundamental data. Note that our analysis may not factor in the latest price-sensitive company announcements or qualitative material. Simply Wall St has no position in any stocks mentioned.
About TSXV:BILD
BuildDirect.com Technologies
Operates a marketplace for purchasing and selling building materials online in the United States, Canada, and internationally.
Excellent balance sheet with minimal risk.
Similar Companies
Market Insights

Weekly Picks

THE KINGDOM OF BROWN GOODS: WHY MGPI IS BEING CRUSHED BY INVENTORY & PRIMED FOR RESURRECTION


Why Vertical Aerospace (NYSE: EVTL) is Worth Possibly Over 13x its Current Price


The Quiet Giant That Became AI’s Power Grid
Recently Updated Narratives


MINISO's fair value is projected at 26.69 with an anticipated PE ratio shift of 20x

Fiverr International will transform the freelance industry with AI-powered growth

Stride Stock: Online Education Finds Its Second Act
Popular Narratives


MicroVision will explode future revenue by 380.37% with a vision towards success


Crazy Undervalued 42 Baggers Silver Play (Active & Running Mine)


