- Canada
- /
- Metals and Mining
- /
- TSX:STLC
Despite lower earnings than five years ago, Stelco Holdings (TSE:STLC) investors are up 221% since then


It might be of some concern to shareholders to see the Stelco Holdings Inc. (TSE:STLC) share price down 16% in the last month. But that scarcely detracts from the really solid long term returns generated by the company over five years. We think most investors would be happy with the 131% return, over that period. We think it's more important to dwell on the long term returns than the short term returns. The more important question is whether the stock is too cheap or too expensive today. Unfortunately not all shareholders will have held it for the long term, so spare a thought for those caught in the 22% decline over the last twelve months.
While the stock has fallen 5.1% this week, it's worth focusing on the longer term and seeing if the stocks historical returns have been driven by the underlying fundamentals.
Check out our latest analysis for Stelco Holdings
In his essay The Superinvestors of Graham-and-Doddsville Warren Buffett described how share prices do not always rationally reflect the value of a business. One imperfect but simple way to consider how the market perception of a company has shifted is to compare the change in the earnings per share (EPS) with the share price movement.
During the last half decade, Stelco Holdings became profitable. That kind of transition can be an inflection point that justifies a strong share price gain, just as we have seen here.
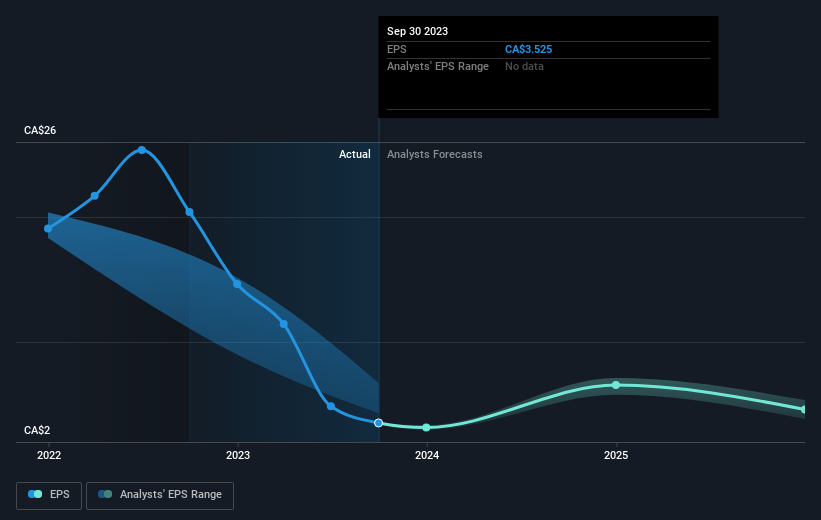
The company's earnings per share (over time) is depicted in the image below (click to see the exact numbers).
We know that Stelco Holdings has improved its bottom line over the last three years, but what does the future have in store? Take a more thorough look at Stelco Holdings' financial health with this free report on its balance sheet.
What About Dividends?
It is important to consider the total shareholder return, as well as the share price return, for any given stock. Whereas the share price return only reflects the change in the share price, the TSR includes the value of dividends (assuming they were reinvested) and the benefit of any discounted capital raising or spin-off. Arguably, the TSR gives a more comprehensive picture of the return generated by a stock. As it happens, Stelco Holdings' TSR for the last 5 years was 221%, which exceeds the share price return mentioned earlier. The dividends paid by the company have thusly boosted the total shareholder return.
A Different Perspective
Stelco Holdings shareholders are down 13% for the year (even including dividends), but the market itself is up 3.3%. However, keep in mind that even the best stocks will sometimes underperform the market over a twelve month period. On the bright side, long term shareholders have made money, with a gain of 26% per year over half a decade. It could be that the recent sell-off is an opportunity, so it may be worth checking the fundamental data for signs of a long term growth trend. I find it very interesting to look at share price over the long term as a proxy for business performance. But to truly gain insight, we need to consider other information, too. Case in point: We've spotted 2 warning signs for Stelco Holdings you should be aware of.
We will like Stelco Holdings better if we see some big insider buys. While we wait, check out this free list of growing companies with considerable, recent, insider buying.
Please note, the market returns quoted in this article reflect the market weighted average returns of stocks that currently trade on Canadian exchanges.
New: Manage All Your Stock Portfolios in One Place
We've created the ultimate portfolio companion for stock investors, and it's free.
• Connect an unlimited number of Portfolios and see your total in one currency
• Be alerted to new Warning Signs or Risks via email or mobile
• Track the Fair Value of your stocks
Have feedback on this article? Concerned about the content? Get in touch with us directly. Alternatively, email editorial-team (at) simplywallst.com.
This article by Simply Wall St is general in nature. We provide commentary based on historical data and analyst forecasts only using an unbiased methodology and our articles are not intended to be financial advice. It does not constitute a recommendation to buy or sell any stock, and does not take account of your objectives, or your financial situation. We aim to bring you long-term focused analysis driven by fundamental data. Note that our analysis may not factor in the latest price-sensitive company announcements or qualitative material. Simply Wall St has no position in any stocks mentioned.
About TSX:STLC
Stelco Holdings
Engages in the production and sale of steel products in Canada, the United States, and internationally.
Excellent balance sheet second-rate dividend payer.
