- Canada
- /
- Metals and Mining
- /
- TSX:LUG
Declining Stock and Solid Fundamentals: Is The Market Wrong About Lundin Gold Inc. (TSE:LUG)?

Lundin Gold (TSE:LUG) has had a rough week with its share price down 5.6%. However, a closer look at its sound financials might cause you to think again. Given that fundamentals usually drive long-term market outcomes, the company is worth looking at. Particularly, we will be paying attention to Lundin Gold's ROE today.
Return on Equity or ROE is a test of how effectively a company is growing its value and managing investors’ money. Put another way, it reveals the company's success at turning shareholder investments into profits.
See our latest analysis for Lundin Gold
How Is ROE Calculated?
Return on equity can be calculated by using the formula:
Return on Equity = Net Profit (from continuing operations) ÷ Shareholders' Equity
So, based on the above formula, the ROE for Lundin Gold is:
11% = US$100m ÷ US$953m (Based on the trailing twelve months to September 2023).
The 'return' is the profit over the last twelve months. That means that for every CA$1 worth of shareholders' equity, the company generated CA$0.11 in profit.
What Is The Relationship Between ROE And Earnings Growth?
Thus far, we have learned that ROE measures how efficiently a company is generating its profits. We now need to evaluate how much profit the company reinvests or "retains" for future growth which then gives us an idea about the growth potential of the company. Generally speaking, other things being equal, firms with a high return on equity and profit retention, have a higher growth rate than firms that don’t share these attributes.
A Side By Side comparison of Lundin Gold's Earnings Growth And 11% ROE
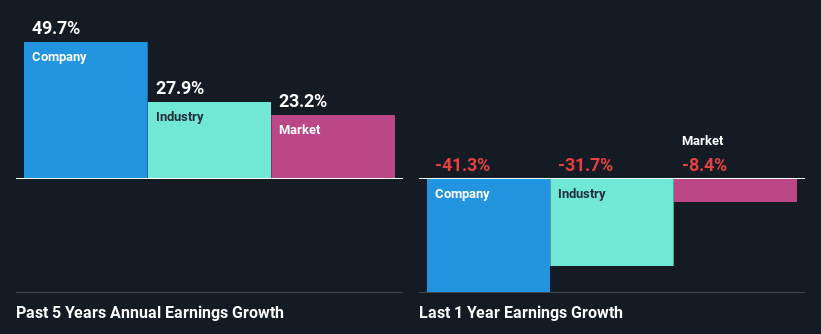
At first glance, Lundin Gold seems to have a decent ROE. On comparing with the average industry ROE of 8.1% the company's ROE looks pretty remarkable. This probably laid the ground for Lundin Gold's significant 50% net income growth seen over the past five years. We reckon that there could also be other factors at play here. For instance, the company has a low payout ratio or is being managed efficiently.
As a next step, we compared Lundin Gold's net income growth with the industry, and pleasingly, we found that the growth seen by the company is higher than the average industry growth of 28%.
Earnings growth is an important metric to consider when valuing a stock. It’s important for an investor to know whether the market has priced in the company's expected earnings growth (or decline). Doing so will help them establish if the stock's future looks promising or ominous. One good indicator of expected earnings growth is the P/E ratio which determines the price the market is willing to pay for a stock based on its earnings prospects. So, you may want to check if Lundin Gold is trading on a high P/E or a low P/E, relative to its industry.
Is Lundin Gold Making Efficient Use Of Its Profits?
Lundin Gold's significant three-year median payout ratio of 69% (where it is retaining only 31% of its income) suggests that the company has been able to achieve a high growth in earnings despite returning most of its income to shareholders.
While Lundin Gold has seen growth in its earnings, it only recently started to pay a dividend. It is most likely that the company decided to impress new and existing shareholders with a dividend. Upon studying the latest analysts' consensus data, we found that the company's future payout ratio is expected to drop to 40% over the next three years. The fact that the company's ROE is expected to rise to 20% over the same period is explained by the drop in the payout ratio.
Conclusion
In total, we are pretty happy with Lundin Gold's performance. In particular, its high ROE is quite noteworthy and also the probable explanation behind its considerable earnings growth. Yet, the company is retaining a small portion of its profits. Which means that the company has been able to grow its earnings in spite of it, so that's not too bad. Having said that, the company's earnings growth is expected to slow down, as forecasted in the current analyst estimates. To know more about the company's future earnings growth forecasts take a look at this free report on analyst forecasts for the company to find out more.
The New Payments ETF Is Live on NASDAQ:
Money is moving to real-time rails, and a newly listed ETF now gives investors direct exposure. Fast settlement. Institutional custody. Simple access.
Explore how this launch could reshape portfolios
Sponsored ContentNew: AI Stock Screener & Alerts
Our new AI Stock Screener scans the market every day to uncover opportunities.
• Dividend Powerhouses (3%+ Yield)
• Undervalued Small Caps with Insider Buying
• High growth Tech and AI Companies
Or build your own from over 50 metrics.
Have feedback on this article? Concerned about the content? Get in touch with us directly. Alternatively, email editorial-team (at) simplywallst.com.
This article by Simply Wall St is general in nature. We provide commentary based on historical data and analyst forecasts only using an unbiased methodology and our articles are not intended to be financial advice. It does not constitute a recommendation to buy or sell any stock, and does not take account of your objectives, or your financial situation. We aim to bring you long-term focused analysis driven by fundamental data. Note that our analysis may not factor in the latest price-sensitive company announcements or qualitative material. Simply Wall St has no position in any stocks mentioned.
About TSX:LUG
Outstanding track record with flawless balance sheet.
Similar Companies
Market Insights

Weekly Picks

Early mover in a fast growing industry. Likely to experience share price volatility as they scale


A case for CA$31.80 (undiluted), aka 8,616% upside from CA$0.37 (an 86 bagger!).


Moderation and Stabilisation: HOLD: Fair Price based on a 4-year Cycle is $12.08
Recently Updated Narratives

Automotive Electronics Manufacturer Consistent and Stable

Airbnb Stock: Platform Growth in a World of Saturation and Scrutiny

Adobe Stock: AI-Fueled ARR Growth Pushes Guidance Higher, But Cost Pressures Loom
Popular Narratives


Crazy Undervalued 42 Baggers Silver Play (Active & Running Mine)


NVDA: Expanding AI Demand Will Drive Major Data Center Investments Through 2026

The AI Infrastructure Giant Grows Into Its Valuation
Trending Discussion


