
Advertisement
- Canada
- /
- Metals and Mining
- /
- TSX:CG
Centerra Gold Inc. (TSE:CG) Held Back By Insufficient Growth Even After Shares Climb 25%
Centerra Gold Inc. (TSE:CG) shareholders are no doubt pleased to see that the share price has bounced 25% in the last month, although it is still struggling to make up recently lost ground. But the gains over the last month weren't enough to make shareholders whole, as the share price is still down 7.7% in the last twelve months.
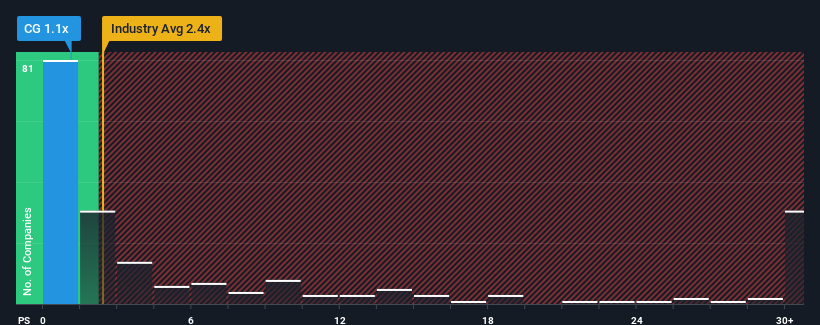
Although its price has surged higher, Centerra Gold may still be sending bullish signals at the moment with its price-to-sales (or "P/S") ratio of 1.1x, since almost half of all companies in the Metals and Mining industry in Canada have P/S ratios greater than 2.4x and even P/S higher than 14x are not unusual. Nonetheless, we'd need to dig a little deeper to determine if there is a rational basis for the reduced P/S.
Check out our latest analysis for Centerra Gold
How Centerra Gold Has Been Performing
Centerra Gold certainly has been doing a good job lately as it's been growing revenue more than most other companies. It might be that many expect the strong revenue performance to degrade substantially, which has repressed the share price, and thus the P/S ratio. If not, then existing shareholders have reason to be quite optimistic about the future direction of the share price.
Want the full picture on analyst estimates for the company? Then our free report on Centerra Gold will help you uncover what's on the horizon.What Are Revenue Growth Metrics Telling Us About The Low P/S?
There's an inherent assumption that a company should underperform the industry for P/S ratios like Centerra Gold's to be considered reasonable.
Retrospectively, the last year delivered an exceptional 29% gain to the company's top line. The latest three year period has also seen an excellent 52% overall rise in revenue, aided by its short-term performance. Accordingly, shareholders would have definitely welcomed those medium-term rates of revenue growth.
Turning to the outlook, the next three years should bring diminished returns, with revenue decreasing 6.6% each year as estimated by the six analysts watching the company. That's not great when the rest of the industry is expected to grow by 8.1% per annum.
In light of this, it's understandable that Centerra Gold's P/S would sit below the majority of other companies. Nonetheless, there's no guarantee the P/S has reached a floor yet with revenue going in reverse. Even just maintaining these prices could be difficult to achieve as the weak outlook is weighing down the shares.
What We Can Learn From Centerra Gold's P/S?
Despite Centerra Gold's share price climbing recently, its P/S still lags most other companies. We'd say the price-to-sales ratio's power isn't primarily as a valuation instrument but rather to gauge current investor sentiment and future expectations.
With revenue forecasts that are inferior to the rest of the industry, it's no surprise that Centerra Gold's P/S is on the lower end of the spectrum. Right now shareholders are accepting the low P/S as they concede future revenue probably won't provide any pleasant surprises. It's hard to see the share price rising strongly in the near future under these circumstances.
There are also other vital risk factors to consider before investing and we've discovered 2 warning signs for Centerra Gold that you should be aware of.
If strong companies turning a profit tickle your fancy, then you'll want to check out this free list of interesting companies that trade on a low P/E (but have proven they can grow earnings).
New: AI Stock Screener & Alerts
Our new AI Stock Screener scans the market every day to uncover opportunities.
• Dividend Powerhouses (3%+ Yield)
• Undervalued Small Caps with Insider Buying
• High growth Tech and AI Companies
Or build your own from over 50 metrics.
Have feedback on this article? Concerned about the content? Get in touch with us directly. Alternatively, email editorial-team (at) simplywallst.com.
This article by Simply Wall St is general in nature. We provide commentary based on historical data and analyst forecasts only using an unbiased methodology and our articles are not intended to be financial advice. It does not constitute a recommendation to buy or sell any stock, and does not take account of your objectives, or your financial situation. We aim to bring you long-term focused analysis driven by fundamental data. Note that our analysis may not factor in the latest price-sensitive company announcements or qualitative material. Simply Wall St has no position in any stocks mentioned.
About TSX:CG
Centerra Gold
Engages in the acquisition, exploration, development, and operation of gold and copper properties in North America, Turkey, and internationally.
Flawless balance sheet and undervalued.
Similar Companies
Market Insights

Advertisement
Community Narratives
MicroVision will explode future revenue by 380.37% with a vision towards success
Fair Value US$60|98.4% undervalued
TH
Community Contributor
The Indispensable Artery for a New North American Economy
Fair Value CA$132.87|0.8% undervalued
TI
Community Contributor
Recently Updated Narratives
CO

composite32 on TAV Havalimanlari Holding ·
TAV Havalimanlari Holding will fly high with 25.68% revenue growth
Fair Value:₺545.1648.6% undervalued
3 followersusers have followed this narrative
0 commentsusers have commented on this narrative
0 likesusers have liked this narrative
RO


Robbo on Fiducian Group ·
Fiducian: Compliance Clouds or Value Opportunity?
Fair Value:AU$120.8% undervalued
1 followerusers have followed this narrative
0 commentsusers have commented on this narrative
0 likesusers have liked this narrative
MA


MarkoVT on COVER ·
Q3 Outlook modestly optimistic
Fair Value:JP¥1.65k1.3% overvalued
1 followerusers have followed this narrative
0 commentsusers have commented on this narrative
0 likesusers have liked this narrative
Popular Narratives
TH

TheWallstreetKing on MicroVision ·
MicroVision will explode future revenue by 380.37% with a vision towards success
Fair Value:US$6098.4% undervalued
93 followersusers have followed this narrative
10 commentsusers have commented on this narrative
18 likesusers have liked this narrative
OS


oscargarcia on Alphabet ·
The company that turned a verb into a global necessity and basically runs the modern internet, digital ads, smartphones, maps, and AI.
Fair Value:US$3405.9% undervalued
136 followersusers have followed this narrative
6 commentsusers have commented on this narrative
18 likesusers have liked this narrative
AN


AnalystConsensusTarget on NVIDIA ·
NVDA: Expanding AI Demand Will Drive Major Data Center Investments Through 2026
Fair Value:US$232.7922.6% undervalued
929 followersusers have followed this narrative
6 commentsusers have commented on this narrative
22 likesusers have liked this narrative