
Legendary fund manager Li Lu (who Charlie Munger backed) once said, 'The biggest investment risk is not the volatility of prices, but whether you will suffer a permanent loss of capital.' It's only natural to consider a company's balance sheet when you examine how risky it is, since debt is often involved when a business collapses. Importantly, Avalon Advanced Materials Inc. (TSE:AVL) does carry debt. But the real question is whether this debt is making the company risky.
When Is Debt Dangerous?
Debt is a tool to help businesses grow, but if a business is incapable of paying off its lenders, then it exists at their mercy. In the worst case scenario, a company can go bankrupt if it cannot pay its creditors. However, a more frequent (but still costly) occurrence is where a company must issue shares at bargain-basement prices, permanently diluting shareholders, just to shore up its balance sheet. Of course, debt can be an important tool in businesses, particularly capital heavy businesses. The first thing to do when considering how much debt a business uses is to look at its cash and debt together.
See our latest analysis for Avalon Advanced Materials
How Much Debt Does Avalon Advanced Materials Carry?
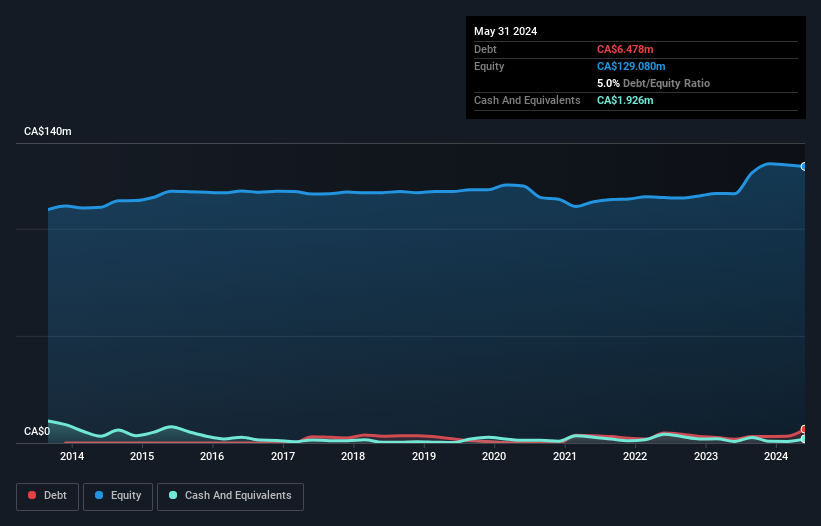
You can click the graphic below for the historical numbers, but it shows that as of May 2024 Avalon Advanced Materials had CA$6.48m of debt, an increase on CA$1.79m, over one year. However, it does have CA$1.93m in cash offsetting this, leading to net debt of about CA$4.55m.
How Strong Is Avalon Advanced Materials' Balance Sheet?
According to the last reported balance sheet, Avalon Advanced Materials had liabilities of CA$1.23m due within 12 months, and liabilities of CA$7.44m due beyond 12 months. Offsetting these obligations, it had cash of CA$1.93m as well as receivables valued at CA$70.7k due within 12 months. So its liabilities outweigh the sum of its cash and (near-term) receivables by CA$6.67m.
Of course, Avalon Advanced Materials has a market capitalization of CA$36.7m, so these liabilities are probably manageable. But there are sufficient liabilities that we would certainly recommend shareholders continue to monitor the balance sheet, going forward. When analysing debt levels, the balance sheet is the obvious place to start. But you can't view debt in total isolation; since Avalon Advanced Materials will need earnings to service that debt. So when considering debt, it's definitely worth looking at the earnings trend. Click here for an interactive snapshot.
Given its lack of meaningful operating revenue, investors are probably hoping that Avalon Advanced Materials finds some valuable resources, before it runs out of money.
Caveat Emptor
Importantly, Avalon Advanced Materials had an earnings before interest and tax (EBIT) loss over the last year. Its EBIT loss was a whopping CA$5.6m. Considering that alongside the liabilities mentioned above does not give us much confidence that company should be using so much debt. So we think its balance sheet is a little strained, though not beyond repair. Another cause for caution is that is bled CA$13m in negative free cash flow over the last twelve months. So in short it's a really risky stock. The balance sheet is clearly the area to focus on when you are analysing debt. However, not all investment risk resides within the balance sheet - far from it. We've identified 4 warning signs with Avalon Advanced Materials (at least 2 which can't be ignored) , and understanding them should be part of your investment process.
If you're interested in investing in businesses that can grow profits without the burden of debt, then check out this free list of growing businesses that have net cash on the balance sheet.
The New Payments ETF Is Live on NASDAQ:
Money is moving to real-time rails, and a newly listed ETF now gives investors direct exposure. Fast settlement. Institutional custody. Simple access.
Explore how this launch could reshape portfolios
Sponsored ContentNew: Manage All Your Stock Portfolios in One Place
We've created the ultimate portfolio companion for stock investors, and it's free.
• Connect an unlimited number of Portfolios and see your total in one currency
• Be alerted to new Warning Signs or Risks via email or mobile
• Track the Fair Value of your stocks
Have feedback on this article? Concerned about the content? Get in touch with us directly. Alternatively, email editorial-team (at) simplywallst.com.
This article by Simply Wall St is general in nature. We provide commentary based on historical data and analyst forecasts only using an unbiased methodology and our articles are not intended to be financial advice. It does not constitute a recommendation to buy or sell any stock, and does not take account of your objectives, or your financial situation. We aim to bring you long-term focused analysis driven by fundamental data. Note that our analysis may not factor in the latest price-sensitive company announcements or qualitative material. Simply Wall St has no position in any stocks mentioned.
Have feedback on this article? Concerned about the content? Get in touch with us directly. Alternatively, email editorial-team@simplywallst.com
About TSX:AVL
Avalon Advanced Materials
Engages in the acquisition, exploration, evaluation, and development of specialty and critical minerals properties in Canada.
Slight risk with mediocre balance sheet.
Market Insights

Weekly Picks

THE KINGDOM OF BROWN GOODS: WHY MGPI IS BEING CRUSHED BY INVENTORY & PRIMED FOR RESURRECTION


Why Vertical Aerospace (NYSE: EVTL) is Worth Possibly Over 13x its Current Price


The Quiet Giant That Became AI’s Power Grid
Recently Updated Narratives


MINISO's fair value is projected at 26.69 with an anticipated PE ratio shift of 20x

Fiverr International will transform the freelance industry with AI-powered growth

Stride Stock: Online Education Finds Its Second Act
Popular Narratives


MicroVision will explode future revenue by 380.37% with a vision towards success


Crazy Undervalued 42 Baggers Silver Play (Active & Running Mine)


