- Canada
- /
- Metals and Mining
- /
- TSX:AGI
Alamos Gold (TSE:AGI) delivers shareholders enviable 35% CAGR over 5 years, surging 3.1% in the last week alone


We think all investors should try to buy and hold high quality multi-year winners. And we've seen some truly amazing gains over the years. Don't believe it? Then look at the Alamos Gold Inc. (TSE:AGI) share price. It's 320% higher than it was five years ago. If that doesn't get you thinking about long term investing, we don't know what will. It's also good to see the share price up 18% over the last quarter. But this could be related to the strong market, which is up 7.5% in the last three months.
On the back of a solid 7-day performance, let's check what role the company's fundamentals have played in driving long term shareholder returns.
View our latest analysis for Alamos Gold
To paraphrase Benjamin Graham: Over the short term the market is a voting machine, but over the long term it's a weighing machine. One way to examine how market sentiment has changed over time is to look at the interaction between a company's share price and its earnings per share (EPS).
During the last half decade, Alamos Gold became profitable. That kind of transition can be an inflection point that justifies a strong share price gain, just as we have seen here. Since the company was unprofitable five years ago, but not three years ago, it's worth taking a look at the returns in the last three years, too. Indeed, the Alamos Gold share price has gained 180% in three years. During the same period, EPS grew by 99% each year. This EPS growth is higher than the 41% average annual increase in the share price over the same three years. Therefore, it seems the market has moderated its expectations for growth, somewhat.
The image below shows how EPS has tracked over time (if you click on the image you can see greater detail).
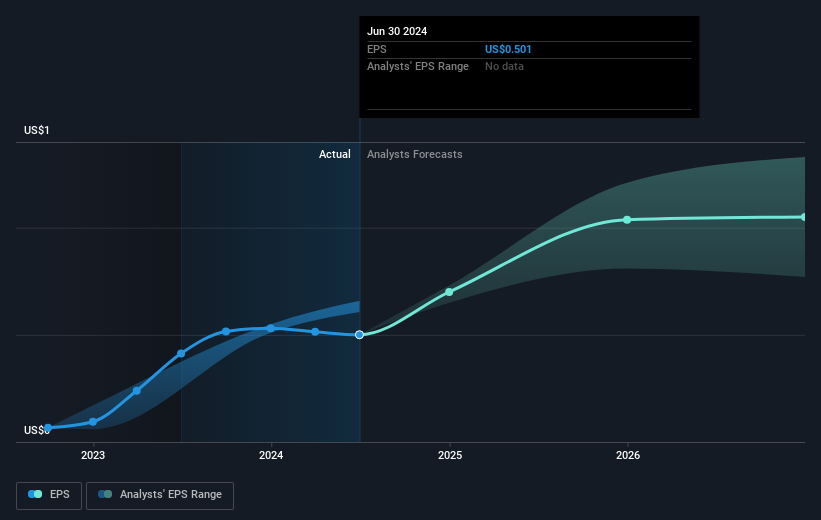
We know that Alamos Gold has improved its bottom line over the last three years, but what does the future have in store? If you are thinking of buying or selling Alamos Gold stock, you should check out this FREE detailed report on its balance sheet.
What About Dividends?
As well as measuring the share price return, investors should also consider the total shareholder return (TSR). The TSR incorporates the value of any spin-offs or discounted capital raisings, along with any dividends, based on the assumption that the dividends are reinvested. Arguably, the TSR gives a more comprehensive picture of the return generated by a stock. We note that for Alamos Gold the TSR over the last 5 years was 341%, which is better than the share price return mentioned above. And there's no prize for guessing that the dividend payments largely explain the divergence!
A Different Perspective
We're pleased to report that Alamos Gold shareholders have received a total shareholder return of 60% over one year. Of course, that includes the dividend. Since the one-year TSR is better than the five-year TSR (the latter coming in at 35% per year), it would seem that the stock's performance has improved in recent times. In the best case scenario, this may hint at some real business momentum, implying that now could be a great time to delve deeper. It's always interesting to track share price performance over the longer term. But to understand Alamos Gold better, we need to consider many other factors. Consider for instance, the ever-present spectre of investment risk. We've identified 1 warning sign with Alamos Gold , and understanding them should be part of your investment process.
Of course Alamos Gold may not be the best stock to buy. So you may wish to see this free collection of growth stocks.
Please note, the market returns quoted in this article reflect the market weighted average returns of stocks that currently trade on Canadian exchanges.
New: Manage All Your Stock Portfolios in One Place
We've created the ultimate portfolio companion for stock investors, and it's free.
• Connect an unlimited number of Portfolios and see your total in one currency
• Be alerted to new Warning Signs or Risks via email or mobile
• Track the Fair Value of your stocks
Have feedback on this article? Concerned about the content? Get in touch with us directly. Alternatively, email editorial-team (at) simplywallst.com.
This article by Simply Wall St is general in nature. We provide commentary based on historical data and analyst forecasts only using an unbiased methodology and our articles are not intended to be financial advice. It does not constitute a recommendation to buy or sell any stock, and does not take account of your objectives, or your financial situation. We aim to bring you long-term focused analysis driven by fundamental data. Note that our analysis may not factor in the latest price-sensitive company announcements or qualitative material. Simply Wall St has no position in any stocks mentioned.
About TSX:AGI
Alamos Gold
Engages in the acquisition, exploration, development, and extraction of precious metals in Canada and Mexico.
Reasonable growth potential with adequate balance sheet.
Similar Companies
Market Insights

Community Narratives


