Great-West Lifeco (TSE:GWO) jumps 4.5% this week, though earnings growth is still tracking behind five-year shareholder returns


When you buy shares in a company, it's worth keeping in mind the possibility that it could fail, and you could lose your money. But on the bright side, if you buy shares in a high quality company at the right price, you can gain well over 100%. For instance, the price of Great-West Lifeco Inc. (TSE:GWO) stock is up an impressive 133% over the last five years. And in the last week the share price has popped 4.5%.
After a strong gain in the past week, it's worth seeing if longer term returns have been driven by improving fundamentals.
We check all companies for important risks. See what we found for Great-West Lifeco in our free report.There is no denying that markets are sometimes efficient, but prices do not always reflect underlying business performance. By comparing earnings per share (EPS) and share price changes over time, we can get a feel for how investor attitudes to a company have morphed over time.
During five years of share price growth, Great-West Lifeco achieved compound earnings per share (EPS) growth of 13% per year. This EPS growth is slower than the share price growth of 18% per year, over the same period. So it's fair to assume the market has a higher opinion of the business than it did five years ago. That's not necessarily surprising considering the five-year track record of earnings growth.
The company's earnings per share (over time) is depicted in the image below (click to see the exact numbers).
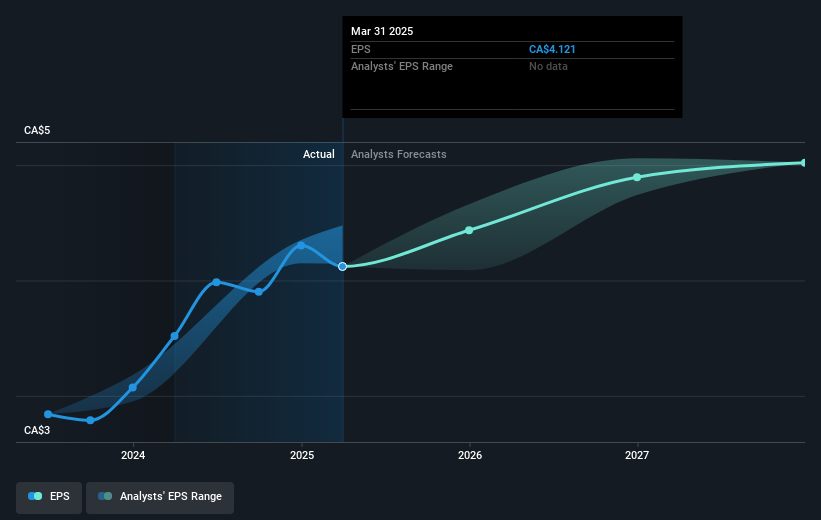
We know that Great-West Lifeco has improved its bottom line lately, but is it going to grow revenue? You could check out this free report showing analyst revenue forecasts.
What About Dividends?
When looking at investment returns, it is important to consider the difference between total shareholder return (TSR) and share price return. The TSR incorporates the value of any spin-offs or discounted capital raisings, along with any dividends, based on the assumption that the dividends are reinvested. So for companies that pay a generous dividend, the TSR is often a lot higher than the share price return. In the case of Great-West Lifeco, it has a TSR of 206% for the last 5 years. That exceeds its share price return that we previously mentioned. This is largely a result of its dividend payments!
A Different Perspective
We're pleased to report that Great-West Lifeco shareholders have received a total shareholder return of 28% over one year. And that does include the dividend. Since the one-year TSR is better than the five-year TSR (the latter coming in at 25% per year), it would seem that the stock's performance has improved in recent times. Someone with an optimistic perspective could view the recent improvement in TSR as indicating that the business itself is getting better with time. If you would like to research Great-West Lifeco in more detail then you might want to take a look at whether insiders have been buying or selling shares in the company.
For those who like to find winning investments this free list of undervalued companies with recent insider purchasing, could be just the ticket.
Please note, the market returns quoted in this article reflect the market weighted average returns of stocks that currently trade on Canadian exchanges.
If you're looking to trade Great-West Lifeco, open an account with the lowest-cost platform trusted by professionals, Interactive Brokers.
With clients in over 200 countries and territories, and access to 160 markets, IBKR lets you trade stocks, options, futures, forex, bonds and funds from a single integrated account.
Enjoy no hidden fees, no account minimums, and FX conversion rates as low as 0.03%, far better than what most brokers offer.
Sponsored ContentNew: Manage All Your Stock Portfolios in One Place
We've created the ultimate portfolio companion for stock investors, and it's free.
• Connect an unlimited number of Portfolios and see your total in one currency
• Be alerted to new Warning Signs or Risks via email or mobile
• Track the Fair Value of your stocks
Have feedback on this article? Concerned about the content? Get in touch with us directly. Alternatively, email editorial-team (at) simplywallst.com.
This article by Simply Wall St is general in nature. We provide commentary based on historical data and analyst forecasts only using an unbiased methodology and our articles are not intended to be financial advice. It does not constitute a recommendation to buy or sell any stock, and does not take account of your objectives, or your financial situation. We aim to bring you long-term focused analysis driven by fundamental data. Note that our analysis may not factor in the latest price-sensitive company announcements or qualitative material. Simply Wall St has no position in any stocks mentioned.
About TSX:GWO
Great-West Lifeco
Engages in the life and health insurance, retirement savings, wealth and asset management, and reinsurance businesses in Canada, the United States, and Europe.
Undervalued with solid track record and pays a dividend.
Similar Companies
Market Insights

Community Narratives


