
Advertisement
Howard Marks put it nicely when he said that, rather than worrying about share price volatility, 'The possibility of permanent loss is the risk I worry about... and every practical investor I know worries about.' When we think about how risky a company is, we always like to look at its use of debt, since debt overload can lead to ruin. Importantly, TC Energy Corporation (TSE:TRP) does carry debt. But the more important question is: how much risk is that debt creating?
When Is Debt A Problem?
Generally speaking, debt only becomes a real problem when a company can't easily pay it off, either by raising capital or with its own cash flow. Ultimately, if the company can't fulfill its legal obligations to repay debt, shareholders could walk away with nothing. While that is not too common, we often do see indebted companies permanently diluting shareholders because lenders force them to raise capital at a distressed price. Having said that, the most common situation is where a company manages its debt reasonably well - and to its own advantage. When we examine debt levels, we first consider both cash and debt levels, together.
Check out our latest analysis for TC Energy
How Much Debt Does TC Energy Carry?
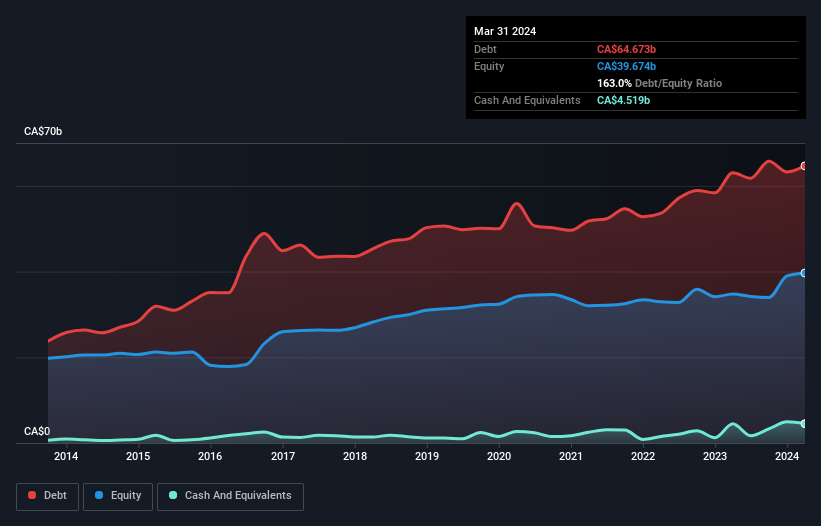
The chart below, which you can click on for greater detail, shows that TC Energy had CA$64.7b in debt in March 2024; about the same as the year before. However, it also had CA$4.52b in cash, and so its net debt is CA$60.2b.
A Look At TC Energy's Liabilities
Zooming in on the latest balance sheet data, we can see that TC Energy had liabilities of CA$12.7b due within 12 months and liabilities of CA$75.6b due beyond that. On the other hand, it had cash of CA$4.52b and CA$4.55b worth of receivables due within a year. So its liabilities outweigh the sum of its cash and (near-term) receivables by CA$79.3b.
When you consider that this deficiency exceeds the company's huge CA$60.8b market capitalization, you might well be inclined to review the balance sheet intently. Hypothetically, extremely heavy dilution would be required if the company were forced to pay down its liabilities by raising capital at the current share price.
We use two main ratios to inform us about debt levels relative to earnings. The first is net debt divided by earnings before interest, tax, depreciation, and amortization (EBITDA), while the second is how many times its earnings before interest and tax (EBIT) covers its interest expense (or its interest cover, for short). Thus we consider debt relative to earnings both with and without depreciation and amortization expenses.
TC Energy shareholders face the double whammy of a high net debt to EBITDA ratio (6.2), and fairly weak interest coverage, since EBIT is just 2.2 times the interest expense. This means we'd consider it to have a heavy debt load. The good news is that TC Energy improved its EBIT by 5.8% over the last twelve months, thus gradually reducing its debt levels relative to its earnings. There's no doubt that we learn most about debt from the balance sheet. But ultimately the future profitability of the business will decide if TC Energy can strengthen its balance sheet over time. So if you're focused on the future you can check out this free report showing analyst profit forecasts.
But our final consideration is also important, because a company cannot pay debt with paper profits; it needs cold hard cash. So we always check how much of that EBIT is translated into free cash flow. Over the last three years, TC Energy barely recorded positive free cash flow, in total. While many companies do operate at break-even, we prefer see substantial free cash flow, especially if a it already has dead.
Our View
On the face of it, TC Energy's level of total liabilities left us tentative about the stock, and its net debt to EBITDA was no more enticing than the one empty restaurant on the busiest night of the year. Having said that, its ability to grow its EBIT isn't such a worry. We're quite clear that we consider TC Energy to be really rather risky, as a result of its balance sheet health. So we're almost as wary of this stock as a hungry kitten is about falling into its owner's fish pond: once bitten, twice shy, as they say. When analysing debt levels, the balance sheet is the obvious place to start. However, not all investment risk resides within the balance sheet - far from it. These risks can be hard to spot. Every company has them, and we've spotted 3 warning signs for TC Energy (of which 2 are concerning!) you should know about.
Of course, if you're the type of investor who prefers buying stocks without the burden of debt, then don't hesitate to discover our exclusive list of net cash growth stocks, today.
Valuation is complex, but we're here to simplify it.
Discover if TC Energy might be undervalued or overvalued with our detailed analysis, featuring fair value estimates, potential risks, dividends, insider trades, and its financial condition.
Access Free AnalysisHave feedback on this article? Concerned about the content? Get in touch with us directly. Alternatively, email editorial-team (at) simplywallst.com.
This article by Simply Wall St is general in nature. We provide commentary based on historical data and analyst forecasts only using an unbiased methodology and our articles are not intended to be financial advice. It does not constitute a recommendation to buy or sell any stock, and does not take account of your objectives, or your financial situation. We aim to bring you long-term focused analysis driven by fundamental data. Note that our analysis may not factor in the latest price-sensitive company announcements or qualitative material. Simply Wall St has no position in any stocks mentioned.
Have feedback on this article? Concerned about the content? Get in touch with us directly. Alternatively, email editorial-team@simplywallst.com
About TSX:TRP
Proven track record second-rate dividend payer.
Similar Companies
Market Insights


Advertisement
Community Narratives
Pole position to benefit from GENIUS Act
Fair Value US$233.04|58.8% undervalued
CH
Community Contributor
IREN will transform from bitcoin miner to leader in AI infrastructure
Fair Value US$21.48|17.5% undervalued
KA
Community Contributor
Behind the Assay: XRF Scientific’s Role in Modern Mining Economics
Fair Value AU$2.10|2.4% undervalued
RO
Community Contributor