

Key Insights
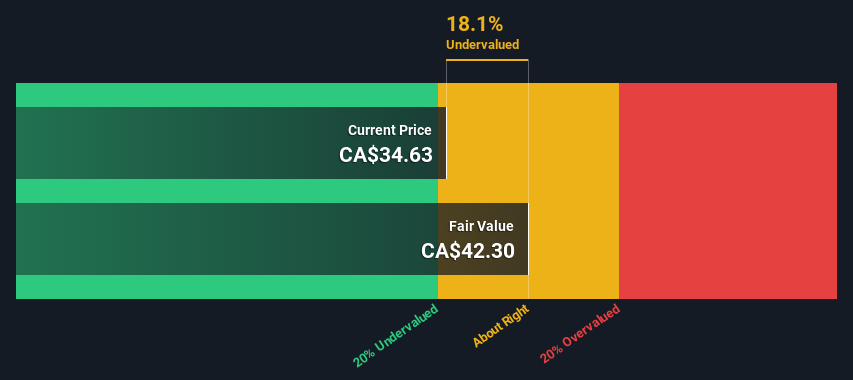
- The projected fair value for Keyera is CA$42.30 based on 2 Stage Free Cash Flow to Equity
- With CA$34.63 share price, Keyera appears to be trading close to its estimated fair value
- Our fair value estimate is 16% higher than Keyera's analyst price target of CA$36.43
In this article we are going to estimate the intrinsic value of Keyera Corp. (TSE:KEY) by estimating the company's future cash flows and discounting them to their present value. We will take advantage of the Discounted Cash Flow (DCF) model for this purpose. Don't get put off by the jargon, the math behind it is actually quite straightforward.
Remember though, that there are many ways to estimate a company's value, and a DCF is just one method. If you want to learn more about discounted cash flow, the rationale behind this calculation can be read in detail in the Simply Wall St analysis model.
See our latest analysis for Keyera
Step By Step Through The Calculation
We use what is known as a 2-stage model, which simply means we have two different periods of growth rates for the company's cash flows. Generally the first stage is higher growth, and the second stage is a lower growth phase. In the first stage we need to estimate the cash flows to the business over the next ten years. Where possible we use analyst estimates, but when these aren't available we extrapolate the previous free cash flow (FCF) from the last estimate or reported value. We assume companies with shrinking free cash flow will slow their rate of shrinkage, and that companies with growing free cash flow will see their growth rate slow, over this period. We do this to reflect that growth tends to slow more in the early years than it does in later years.
Generally we assume that a dollar today is more valuable than a dollar in the future, so we need to discount the sum of these future cash flows to arrive at a present value estimate:
10-year free cash flow (FCF) forecast
| 2024 | 2025 | 2026 | 2027 | 2028 | 2029 | 2030 | 2031 | 2032 | 2033 | |
| Levered FCF (CA$, Millions) | CA$697.3m | CA$691.2m | CA$742.8m | CA$768.7m | CA$737.5m | CA$722.5m | CA$716.7m | CA$717.2m | CA$721.9m | CA$729.8m |
| Growth Rate Estimate Source | Analyst x7 | Analyst x7 | Analyst x4 | Analyst x3 | Analyst x2 | Est @ -2.04% | Est @ -0.80% | Est @ 0.06% | Est @ 0.67% | Est @ 1.09% |
| Present Value (CA$, Millions) Discounted @ 8.6% | CA$642 | CA$586 | CA$579 | CA$552 | CA$488 | CA$440 | CA$402 | CA$370 | CA$343 | CA$319 |
("Est" = FCF growth rate estimated by Simply Wall St)
Present Value of 10-year Cash Flow (PVCF) = CA$4.7b
After calculating the present value of future cash flows in the initial 10-year period, we need to calculate the Terminal Value, which accounts for all future cash flows beyond the first stage. The Gordon Growth formula is used to calculate Terminal Value at a future annual growth rate equal to the 5-year average of the 10-year government bond yield of 2.1%. We discount the terminal cash flows to today's value at a cost of equity of 8.6%.
Terminal Value (TV)= FCF2033 × (1 + g) ÷ (r – g) = CA$730m× (1 + 2.1%) ÷ (8.6%– 2.1%) = CA$11b
Present Value of Terminal Value (PVTV)= TV / (1 + r)10= CA$11b÷ ( 1 + 8.6%)10= CA$5.0b
The total value is the sum of cash flows for the next ten years plus the discounted terminal value, which results in the Total Equity Value, which in this case is CA$9.7b. To get the intrinsic value per share, we divide this by the total number of shares outstanding. Relative to the current share price of CA$34.6, the company appears about fair value at a 18% discount to where the stock price trades currently. The assumptions in any calculation have a big impact on the valuation, so it is better to view this as a rough estimate, not precise down to the last cent.
The Assumptions
Now the most important inputs to a discounted cash flow are the discount rate, and of course, the actual cash flows. You don't have to agree with these inputs, I recommend redoing the calculations yourself and playing with them. The DCF also does not consider the possible cyclicality of an industry, or a company's future capital requirements, so it does not give a full picture of a company's potential performance. Given that we are looking at Keyera as potential shareholders, the cost of equity is used as the discount rate, rather than the cost of capital (or weighted average cost of capital, WACC) which accounts for debt. In this calculation we've used 8.6%, which is based on a levered beta of 1.424. Beta is a measure of a stock's volatility, compared to the market as a whole. We get our beta from the industry average beta of globally comparable companies, with an imposed limit between 0.8 and 2.0, which is a reasonable range for a stable business.
SWOT Analysis for Keyera
- Earnings growth over the past year exceeded the industry.
- Debt is well covered by earnings and cashflows.
- Dividend is low compared to the top 25% of dividend payers in the Oil and Gas market.
- Annual earnings are forecast to grow faster than the Canadian market.
- Current share price is below our estimate of fair value.
- Dividends are not covered by earnings and cashflows.
- Annual revenue is forecast to grow slower than the Canadian market.
Next Steps:
Valuation is only one side of the coin in terms of building your investment thesis, and it is only one of many factors that you need to assess for a company. It's not possible to obtain a foolproof valuation with a DCF model. Rather it should be seen as a guide to "what assumptions need to be true for this stock to be under/overvalued?" For example, changes in the company's cost of equity or the risk free rate can significantly impact the valuation. For Keyera, we've compiled three essential items you should further examine:
- Risks: We feel that you should assess the 3 warning signs for Keyera (1 can't be ignored!) we've flagged before making an investment in the company.
- Future Earnings: How does KEY's growth rate compare to its peers and the wider market? Dig deeper into the analyst consensus number for the upcoming years by interacting with our free analyst growth expectation chart.
- Other High Quality Alternatives: Do you like a good all-rounder? Explore our interactive list of high quality stocks to get an idea of what else is out there you may be missing!
PS. The Simply Wall St app conducts a discounted cash flow valuation for every stock on the TSX every day. If you want to find the calculation for other stocks just search here.
Valuation is complex, but we're here to simplify it.
Discover if Keyera might be undervalued or overvalued with our detailed analysis, featuring fair value estimates, potential risks, dividends, insider trades, and its financial condition.
Access Free AnalysisHave feedback on this article? Concerned about the content? Get in touch with us directly. Alternatively, email editorial-team (at) simplywallst.com.
This article by Simply Wall St is general in nature. We provide commentary based on historical data and analyst forecasts only using an unbiased methodology and our articles are not intended to be financial advice. It does not constitute a recommendation to buy or sell any stock, and does not take account of your objectives, or your financial situation. We aim to bring you long-term focused analysis driven by fundamental data. Note that our analysis may not factor in the latest price-sensitive company announcements or qualitative material. Simply Wall St has no position in any stocks mentioned.
About TSX:KEY
Keyera
Engages in the gathering and processing of natural gas; and transportation, storage, and marketing of natural gas liquids (NGLs) in Canada and the United States.
Proven track record average dividend payer.
Similar Companies
Market Insights

Community Narratives
