

Some say volatility, rather than debt, is the best way to think about risk as an investor, but Warren Buffett famously said that 'Volatility is far from synonymous with risk.' It's only natural to consider a company's balance sheet when you examine how risky it is, since debt is often involved when a business collapses. We can see that Metro Inc. (TSE:MRU) does use debt in its business. But should shareholders be worried about its use of debt?
Why Does Debt Bring Risk?
Generally speaking, debt only becomes a real problem when a company can't easily pay it off, either by raising capital or with its own cash flow. If things get really bad, the lenders can take control of the business. While that is not too common, we often do see indebted companies permanently diluting shareholders because lenders force them to raise capital at a distressed price. Having said that, the most common situation is where a company manages its debt reasonably well - and to its own advantage. The first step when considering a company's debt levels is to consider its cash and debt together.
View our latest analysis for Metro
How Much Debt Does Metro Carry?
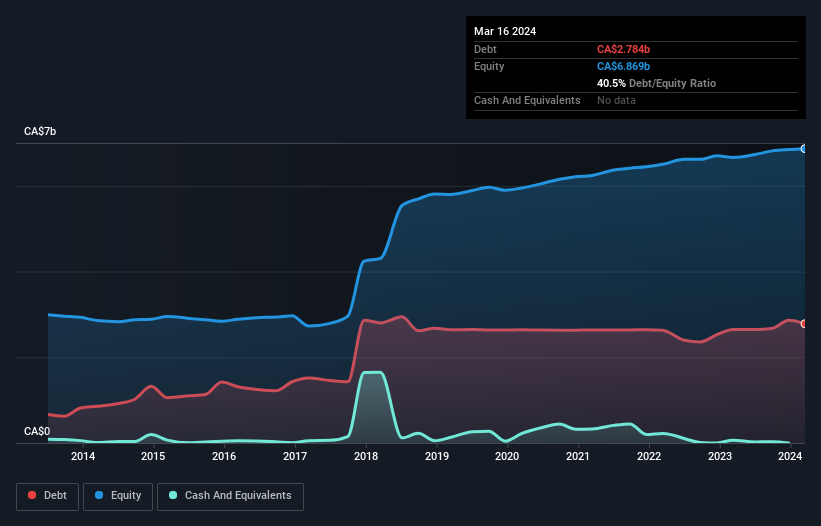
You can click the graphic below for the historical numbers, but it shows that as of March 2024 Metro had CA$2.78b of debt, an increase on CA$2.65b, over one year. Net debt is about the same, since the it doesn't have much cash.
A Look At Metro's Liabilities
The latest balance sheet data shows that Metro had liabilities of CA$2.15b due within a year, and liabilities of CA$4.87b falling due after that. Offsetting this, it had CA$500.0k in cash and CA$832.4m in receivables that were due within 12 months. So it has liabilities totalling CA$6.19b more than its cash and near-term receivables, combined.
Metro has a very large market capitalization of CA$17.1b, so it could very likely raise cash to ameliorate its balance sheet, if the need arose. But it's clear that we should definitely closely examine whether it can manage its debt without dilution.
We measure a company's debt load relative to its earnings power by looking at its net debt divided by its earnings before interest, tax, depreciation, and amortization (EBITDA) and by calculating how easily its earnings before interest and tax (EBIT) cover its interest expense (interest cover). Thus we consider debt relative to earnings both with and without depreciation and amortization expenses.
We'd say that Metro's moderate net debt to EBITDA ratio ( being 1.6), indicates prudence when it comes to debt. And its commanding EBIT of 10.4 times its interest expense, implies the debt load is as light as a peacock feather. The good news is that Metro has increased its EBIT by 2.8% over twelve months, which should ease any concerns about debt repayment. There's no doubt that we learn most about debt from the balance sheet. But it is future earnings, more than anything, that will determine Metro's ability to maintain a healthy balance sheet going forward. So if you want to see what the professionals think, you might find this free report on analyst profit forecasts to be interesting.
Finally, a business needs free cash flow to pay off debt; accounting profits just don't cut it. So we always check how much of that EBIT is translated into free cash flow. During the last three years, Metro produced sturdy free cash flow equating to 68% of its EBIT, about what we'd expect. This free cash flow puts the company in a good position to pay down debt, when appropriate.
Our View
Happily, Metro's impressive interest cover implies it has the upper hand on its debt. And the good news does not stop there, as its conversion of EBIT to free cash flow also supports that impression! All these things considered, it appears that Metro can comfortably handle its current debt levels. Of course, while this leverage can enhance returns on equity, it does bring more risk, so it's worth keeping an eye on this one. When analysing debt levels, the balance sheet is the obvious place to start. However, not all investment risk resides within the balance sheet - far from it. Case in point: We've spotted 1 warning sign for Metro you should be aware of.
At the end of the day, it's often better to focus on companies that are free from net debt. You can access our special list of such companies (all with a track record of profit growth). It's free.
New: Manage All Your Stock Portfolios in One Place
We've created the ultimate portfolio companion for stock investors, and it's free.
• Connect an unlimited number of Portfolios and see your total in one currency
• Be alerted to new Warning Signs or Risks via email or mobile
• Track the Fair Value of your stocks
Have feedback on this article? Concerned about the content? Get in touch with us directly. Alternatively, email editorial-team (at) simplywallst.com.
This article by Simply Wall St is general in nature. We provide commentary based on historical data and analyst forecasts only using an unbiased methodology and our articles are not intended to be financial advice. It does not constitute a recommendation to buy or sell any stock, and does not take account of your objectives, or your financial situation. We aim to bring you long-term focused analysis driven by fundamental data. Note that our analysis may not factor in the latest price-sensitive company announcements or qualitative material. Simply Wall St has no position in any stocks mentioned.
Have feedback on this article? Concerned about the content? Get in touch with us directly. Alternatively, email editorial-team@simplywallst.com
About TSX:MRU
Metro
Through its subsidiaries, operates as a retailer, franchisor, distributor, and manufacturer in the food and pharmaceutical sectors in Canada.
Good value with adequate balance sheet and pays a dividend.
Similar Companies
Market Insights

Community Narratives
